. 2025 Jan 21;26(1):24.
doi: 10.1186/s12859-025-06039-x.

ClearFinder: a Python GUI for annotating cells in cleared mouse brain

Affiliations

ClearFinder: a Python GUI for annotating cells in cleared mouse brain

Stefan Pastore et al. BMC Bioinformatics. .

Abstract

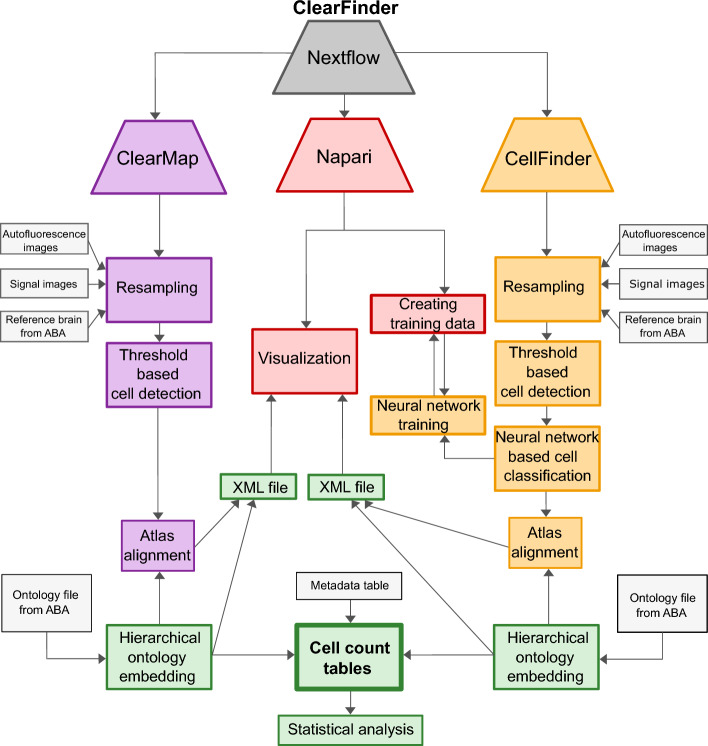
Background: Tissue clearing combined with light-sheet microscopy is gaining popularity among neuroscientists interested in unbiased assessment of their samples in 3D volume. However, the analysis of such data remains a challenge. ClearMap and CellFinder are tools for analyzing neuronal activity maps in an intact volume of cleared mouse brains. However, these tools lack a user interface, restricting accessibility primarily to scientists proficient in advanced Python programming. The application presented here aims to bridge this gap and make data analysis accessible to a wider scientific community.

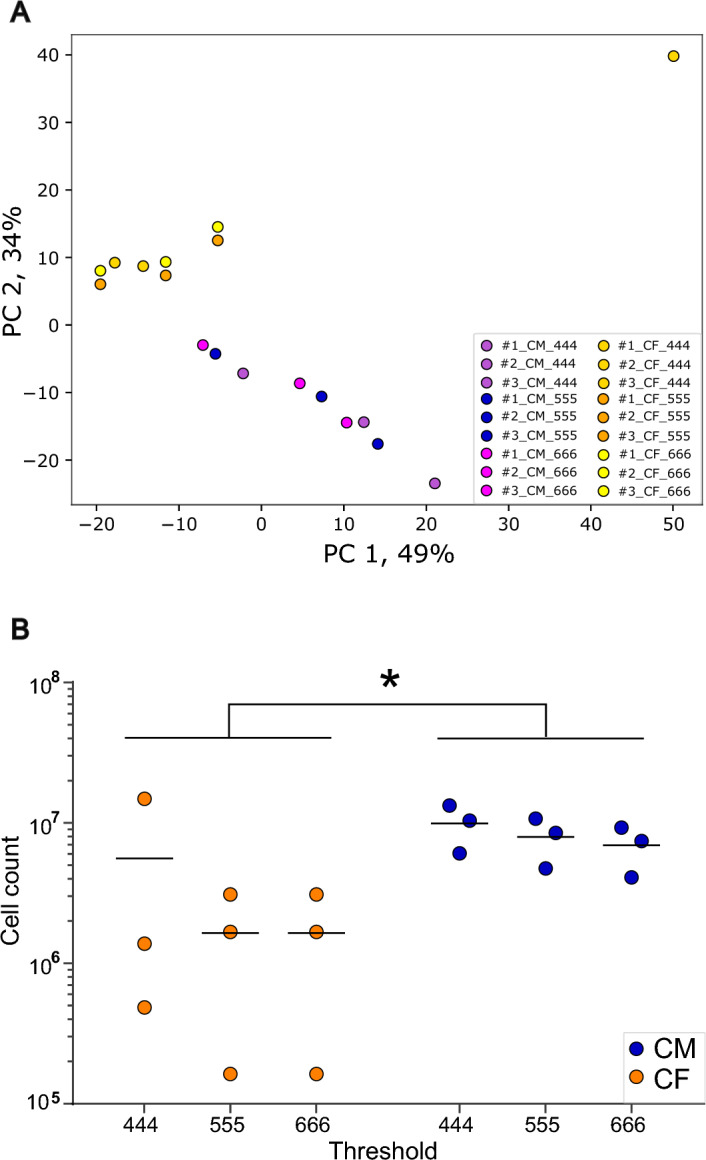
Results: We developed an easy-to-adopt graphical user interface for cell quantification and group analysis of whole cleared adult mouse brains. Fundamental statistical analysis, such as PCA and box plots, and additional visualization features allow for quick data evaluation and quality checks. Furthermore, we present a use case of ClearFinder GUI for cross-analyzing the same samples with two cell counting tools, highlighting the discrepancies in cell detection efficiency between them.

Conclusions: Our easily accessible tool allows more researchers to implement the methodology, troubleshoot arising issues, and develop quality checks, benchmarking, and standardized analysis pipelines for cell detection and region annotation in whole volumes of cleared brains.

Keywords: 3D volumetric imaging; Atlas alignment; Cell count; Tissue clearing.


Conflict of interest statement

Declarations. Ethics approval and consent to participate: All experiments were performed according to the European Community's Council Directive of 22 September 2010 (2010/63EU) and approved by the respective agency of the State Rhineland-Palatinate (Landesuntersuchungsamt, permit number G-17-1-021). Consent for publication: Not applicable. Competing interests: The authors declare that they have no competing interests.

Figures

Fig. 1
Fig. 1
ClearFinder GUI architecture. Schematic representation of the workflow, unifying both analysis tools under one GUI. Trapezoids indicate individual software packages: violet—ClearMap, red—Napari, orange—CellFinder, grey—Nextflow. Separate analysis steps with each package are indicated in rectangular boxes of respective colors. Light-grey boxes indicate the input from the user. Green boxes indicate the output of ClearFinder GUI. ABA—Allen Brain Atlas
Fig. 2
Fig. 2
ClearFinder GUI interface. A A scheme illustrating a step-by-step process of loading, processing and analysis of the data, orchestrated by the ClearFinder GUI. Top row represents the major processing steps, including the selection options in black boxes below. B A screenshot of the GUI interface depicting the last step of the GUI wizard allowing basic analysis and visualization of obtained results
Fig. 3
Fig. 3
Differences in total cell counts between ClearMap and CellFinder. PCA plot of all cell counts in/across all brain regions. GFP-positive cells were detected in all regions of three sample using two methods and three detection thresholds. Yellow, orange and dark-orange dots indicate data obtained with CellFinder (CF), magenta, blue and violet dots indicate data processed with ClearMap (CM). CF dots were displaced by 2% vertically to avoid a complete overlap. PC—principal component. B Total cell counts across all regions. Total counts of GFP-positive cells detected across all brain regions using two methods and three detection thresholds. The y axis represents the log-transformed cell counts. Significant differences between methods identified by 2-way ANOVA, pmethod = 0.0165, pthreshold = 0.3131, pmethod×threshold = 0.3131. *p < 0.05. CF—CellFinder, CM—ClearMap
Fig. 4
Fig. 4
Cell detection efficiency. Sample #1 and Sample #2 analyzed with ClearMap (A, C) and CellFinder (B, D) using threshold 555. Sample #3 analyzed with ClearMap (E) and CellFinder (F) using threshold 555, marked by a green rectangle. Yellow circles indicate cell maxima: “cells”. Blue circles indicate maxima unassigned to a brain region: “non-cells”. The radius of the cells indicates the proximity to the cell core in the selected optical plane. Smaller circles indicate the cell maxima out of plane. Scale bar: 150 µm. G Heatmap indicating the number of cells detected in subregions of the hippocampal area, as detected in each sample by ClearMap (CM) and CellFinder (CF) using the same threshold. Sample #3 marked by a green rectangle. Color-bar corresponds to cell count

References

    1. DeNardo L, Luo L. Genetic strategies to access activated neurons. Curr Opin Neurobiol. 2017;45:121–9. 10.1016/j.conb.2017.05.014. - PMC - PubMed
    1. Ueda HR, Erturk A, Chung K, Gradinaru V, Chedotal A, Tomancak P, et al. Tissue clearing and its applications in neuroscience. Nat Rev Neurosci. 2020;21:61–79. 10.1038/s41583-019-0250-1. - PubMed
    1. Renier N, Adams EL, Kirst C, Wu Z, Azevedo R, Kohl J, et al. Mapping of brain activity by automated volume analysis of immediate early genes. Cell. 2016;165:1789–802. 10.1016/j.cell.2016.05.007. - PMC - PubMed
    1. Kirst C, Skriabine S, Vieites-Prado A, Topilko T, Bertin P, Gerschenfeld G, et al. Mapping the fine-scale organization and plasticity of the brain vasculature. Cell. 2020;180:780-795.e25. 10.1016/j.cell.2020.01.028. - PubMed
    1. Tyson AL, Rousseau CV, Niedworok CJ, Keshavarzi S, Tsitoura C, Cossell L, et al. A deep learning algorithm for 3D cell detection in whole mouse brain image datasets. Plos Comput Biol. 2021;17:e1009074. 10.1371/journal.pcbi.1009074. - PMC - PubMed

LinkOut - more resources