

Synergistic effects of Vachellia nilotica-derived zinc oxide nanoparticles and melatonin on drought tolerance in Fragaria × ananassa
- PMID: 39838302
- PMCID: PMC11752616
- DOI: 10.1186/s12870-025-06114-8
Synergistic effects of Vachellia nilotica-derived zinc oxide nanoparticles and melatonin on drought tolerance in Fragaria × ananassa
Abstract
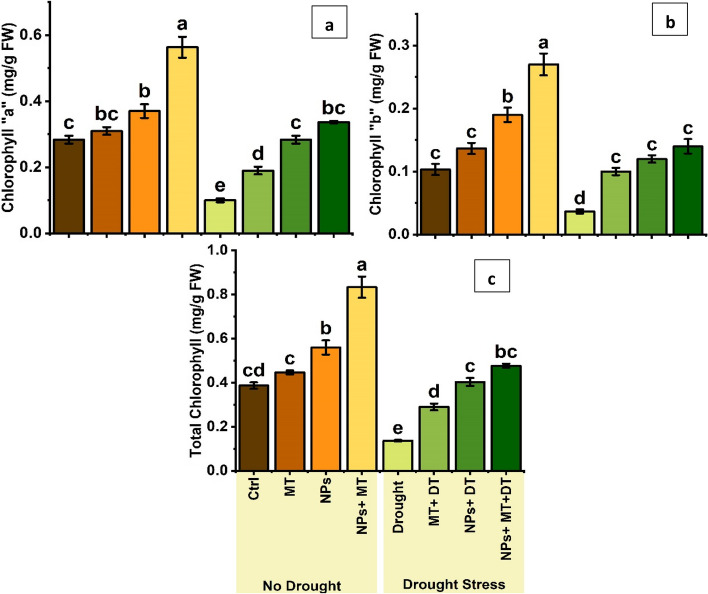
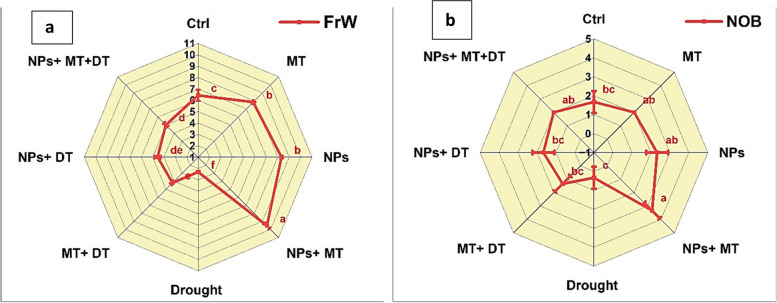
This study investigates the synergistic effects of zinc oxide nanoparticles (ZnO NPs) and melatonin (MT) on Fragaria × ananassa (strawberry) plants under drought stress, focusing on growth, fruit biomass, and stress tolerance. ZnO NPs enhance nutrient uptake and stress resistance, while MT regulates growth hormones and boosts photosynthetic efficiency. Seven treatments were evaluated: T1 (no stress, 0.5 g/L ZnO NPs + 0.1 g/L MT), T2 (no stress, 0.5 g/L ZnO NPs), T3 (no stress, 0.1 g/L MT), T4 (drought stress, no application), T5 (drought stress, 0.5 g/L ZnO NPs + 0.1 g/L MT), T6 (drought stress, 0.5 g/L ZnO NPs), and T7 (drought stress, 0.1 g/L MT). Growth and stress parameters included shoot/root length, fruit biomass, bud number, chlorophyll content, oxidative stress markers (H₂O₂, MDA), and antioxidant enzyme activities in the leaves of Fragaria × ananassa. The combined treatment (ZnO NPs + MT) consistently outperformed others, achieving the highest growth metrics under both conditions: shoot length (22.33 ± 1.53 cm non-stress, 15.00 ± 1.53 cm drought), root length (18.67 ± 1.53 cm non-stress, 12.00 ± 1.53 cm drought), and fruit biomass (9.55 ± 0.31 g non-stress, 5.02 ± 0.23 g drought). Bud formation peaked at 3.33 ± 0.58 buds/plant non-stress and 2.00 ± 0.00 buds/plant drought. Under drought, the combined treatment also enhanced chlorophyll content (2.47 ± 0.20 mg/g FW) and significantly reduced H₂O₂ (28.67 ± 2.52 µmol/g FW) and MDA (4.21 ± 0.10 µmol/g FW) levels, while maximizing antioxidant enzyme activities (SOD: 121.67 ± 7.64 U/g FW, POD: 206.33 ± 14.84 U/g FW, CAT: 48.00 ± 3.61 U/g FW). These findings highlight the combined application of ZnO NPs and MT as a promising strategy to enhance growth and stress tolerance in strawberry plants, warranting further research on optimized concentrations, delivery methods, and molecular mechanisms.
Keywords: Drought stress; Growth enhancement; Melatonin; Strawberry plants; ZnO nanoparticles.
© 2025. The Author(s).
Conflict of interest statement
Declarations. Competing interests: The authors declare no competing interests.
Figures


Similar articles
-
Drought stress mitigation and improved yield in Glycine max through foliar application of zinc oxide nanoparticles.Sci Rep. 2024 Nov 13;14(1):27898. doi: 10.1038/s41598-024-78504-1. Sci Rep. 2024. PMID: 39537733 Free PMC article.
-
Zinc oxide nanoparticles alleviates the adverse effects of cadmium stress on Oryza sativa via modulation of the photosynthesis and antioxidant defense system.Ecotoxicol Environ Saf. 2021 Sep 1;220:112401. doi: 10.1016/j.ecoenv.2021.112401. Epub 2021 Jun 9. Ecotoxicol Environ Saf. 2021. PMID: 34118747
-
Metallic allies in drought resilience: Unveiling the influence of silver and zinc oxide nanoparticles on enhancing tomato (Solanum lycopersicum) resistance through oxidative stress regulation.Plant Physiol Biochem. 2024 Jul;212:108722. doi: 10.1016/j.plaphy.2024.108722. Epub 2024 May 15. Plant Physiol Biochem. 2024. PMID: 38761543
-
Coactive role of zinc oxide nanoparticles and plant growth promoting rhizobacteria for mitigation of synchronized effects of heat and drought stress in wheat plants.Chemosphere. 2022 Jun;297:133982. doi: 10.1016/j.chemosphere.2022.133982. Epub 2022 Feb 15. Chemosphere. 2022. PMID: 35181419
-
Foliar application of zinc oxide nanoparticles: An effective strategy to mitigate drought stress in cucumber seedling by modulating antioxidant defense system and osmolytes accumulation.Chemosphere. 2022 Feb;289:133202. doi: 10.1016/j.chemosphere.2021.133202. Epub 2021 Dec 7. Chemosphere. 2022. PMID: 34890613
Cited by
-
Impact of Hydrothermal Treatment on the Bioactive Compounds of Different Brown Rice Varieties in India.Appl Biochem Biotechnol. 2025 Aug 6. doi: 10.1007/s12010-025-05322-0. Online ahead of print. Appl Biochem Biotechnol. 2025. PMID: 40768180
References
-
- Sharma S, Joshi VK, Abrol GS. An overview on strawberry [Fragaria × ananassa (Weston) Duchesne ex Rozier] wine production technology, composition, maturation and quality evaluation. Nat Prod Radiance. 2009;8(4):356–65.
-
- Bezerra M, Ribeiro M, Cosme F, Nunes FM. Overview of the distinctive characteristics of strawberry, raspberry, and blueberry in berries, berry wines, and berry spirits. Compr Rev Food Sci Food Saf. 2024;23(3): e13354. 10.1111/1541-4337.13354. - PubMed
-
- Simpson D. The economic importance of strawberry crops. In: Hytönen T, Graham J, Harrison R, editors. The genomes of rosaceous berries and their wild relatives. Compendium of plant genomes. Cham: Springer; 2018. 10.1007/978-3-319-76020-9_1.
-
- Yenni M, Ibrahim MH, Nulit R, Sakimin SZ. Influence of drought stress on growth, biochemical changes and leaf gas exchange of strawberry (Fragaria × ananassa Duch.) In Indonesia. AIMS Agric Food. 2022;7(1):37–60. 10.3934/agrfood.2022003.
MeSH terms
Substances
LinkOut - more resources
Full Text Sources
Miscellaneous
