

Uncovering glycolysis-driven molecular subtypes in diabetic nephropathy: a WGCNA and machine learning approach for diagnostic precision
- PMID: 39838413
- PMCID: PMC11748251
- DOI: 10.1186/s13062-025-00601-6
Uncovering glycolysis-driven molecular subtypes in diabetic nephropathy: a WGCNA and machine learning approach for diagnostic precision
Abstract
Introduction: Diabetic nephropathy (DN) is a common diabetes-related complication with unclear underlying pathological mechanisms. Although recent studies have linked glycolysis to various pathological states, its role in DN remains largely underexplored.
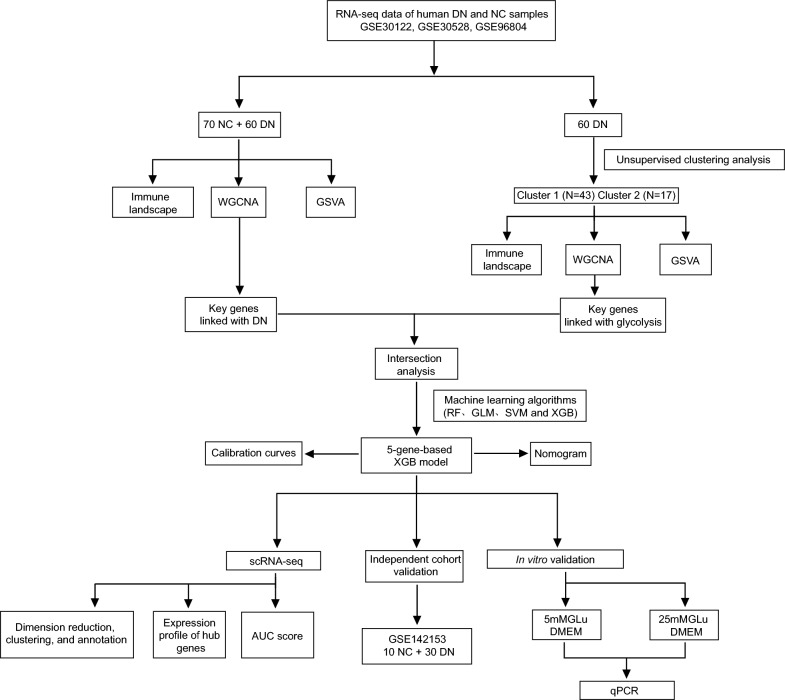
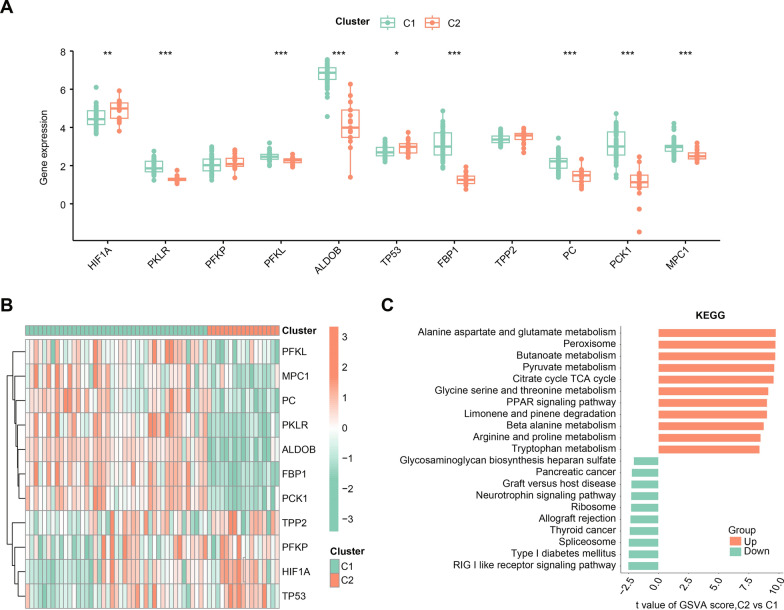
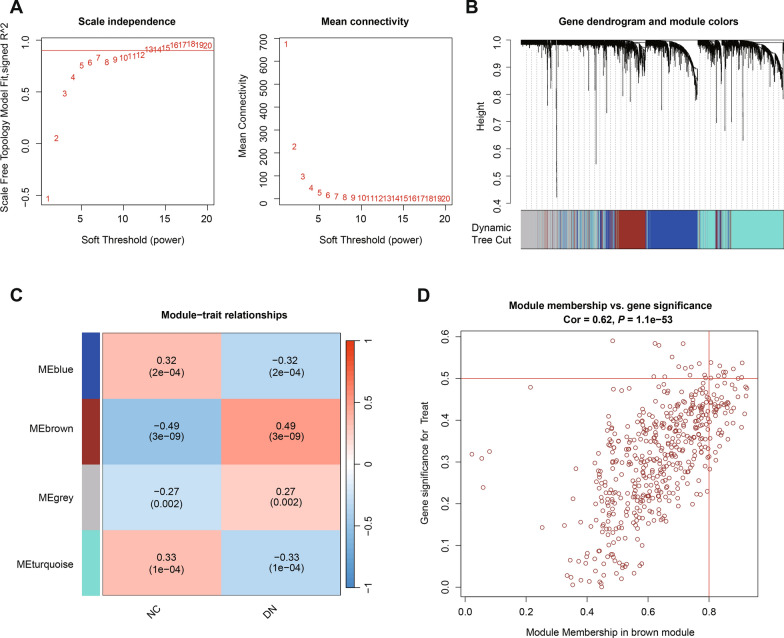
Methods: In this study, the expression patterns of glycolysis-related genes (GRGs) were first analyzed using the GSE30122, GSE30528, and GSE96804 datasets, followed by an evaluation of the immune landscape in DN. An unsupervised consensus clustering of DN samples from the same dataset was conducted based on differentially expressed GRGs. The hub genes associated with DN and glycolysis-related clusters were identified via weighted gene co-expression network analysis (WGCNA) and machine learning algorithms. Finally, the expression patterns of these hub genes were validated using single-cell sequencing data and quantitative real-time polymerase chain reaction (qRT-PCR).
Results: Eleven GRGs showed abnormal expression in DN samples, leading to the identification of two distinct glycolysis clusters, each with its own immune profile and functional pathways. The analysis of the GSE142153 dataset showed that these clusters had specific immune characteristics. Furthermore, the Extreme Gradient Boosting (XGB) model was the most effective in diagnosing DN. The five most significant variables, including GATM, PCBD1, F11, HRSP12, and G6PC, were identified as hub genes for further investigation. Single-cell sequencing data showed that the hub genes were predominantly expressed in proximal tubular epithelial cells. In vitro experiments confirmed the expression pattern in NC.
Conclusion: Our study provides valuable insights into the molecular mechanisms underlying DN, highlighting the involvement of GRGs and immune cell infiltration.
Keywords: Diabetic nephropathy; Glycolysis; Glycolysis-related genes; Hub genes; Machine learning algorithm.
© 2025. The Author(s).
Conflict of interest statement
Declarations. Ethics approval and consent to participate: In this study, we confirm that all experiments and methods were conducted strictly in accordance with relevant guidelines and regulations. Competing interests: The authors declare no competing interests.
Figures


Similar articles
-
Integrating bioinformatics and machine learning to identify glomerular injury genes and predict drug targets in diabetic nephropathy.Sci Rep. 2025 May 15;15(1):16868. doi: 10.1038/s41598-025-01628-5. Sci Rep. 2025. PMID: 40374840 Free PMC article.
-
Identification and validation of glycolysis-related diagnostic signatures in diabetic nephropathy: a study based on integrative machine learning and single-cell sequence.Front Immunol. 2025 Jan 23;15:1427626. doi: 10.3389/fimmu.2024.1427626. eCollection 2024. Front Immunol. 2025. PMID: 39916957 Free PMC article.
-
Identification of mitochondria-related genes as diagnostic biomarkers for diabetic nephropathy and their correlation with immune infiltration: New insights from bioinformatics analysis.Int Immunopharmacol. 2024 Dec 5;142(Pt A):113114. doi: 10.1016/j.intimp.2024.113114. Epub 2024 Sep 12. Int Immunopharmacol. 2024. PMID: 39265357
-
Utilizing machine learning algorithms to identify biomarkers associated with diabetic nephropathy: A review.Medicine (Baltimore). 2024 Feb 23;103(8):e37235. doi: 10.1097/MD.0000000000037235. Medicine (Baltimore). 2024. PMID: 38394492 Free PMC article. Review.
-
Integrating network pharmacology, molecular docking and simulation approaches with machine learning reveals the multi-target pharmacological mechanism of Berberis integerrima against diabetic nephropathy.J Biomol Struct Dyn. 2025 Mar;43(4):2092-2108. doi: 10.1080/07391102.2023.2294165. Epub 2024 Feb 20. J Biomol Struct Dyn. 2025. PMID: 38379386 Review.
Cited by
-
Identification and validation of tricarboxylic acid cycle-related diagnostic biomarkers for diabetic nephropathy via weighted gene co-expression network analysis and single-cell transcriptome analysis.Acta Diabetol. 2025 Jul 31. doi: 10.1007/s00592-025-02557-5. Online ahead of print. Acta Diabetol. 2025. PMID: 40742465
References
-
- Zhang L, et al. Trends in chronic kidney disease in China. N Engl J Med. 2016;375(9):905–6. 10.1056/NEJMc1602469. - PubMed
MeSH terms
Grants and funding
LinkOut - more resources
Full Text Sources
Medical
Miscellaneous
