. 2025 Jan 21;23(1):17.
doi: 10.1186/s12915-025-02121-1.

Genome sequences of four Ixodes species expands understanding of tick evolution

Affiliations

Genome sequences of four Ixodes species expands understanding of tick evolution

Alexandra Cerqueira de Araujo et al. BMC Biol. .

Abstract

Background: Ticks, hematophagous Acari, pose a significant threat by transmitting various pathogens to their vertebrate hosts during feeding. Despite advances in tick genomics, high-quality genomes were lacking until recently, particularly in the genus Ixodes, which includes the main vectors of Lyme disease.

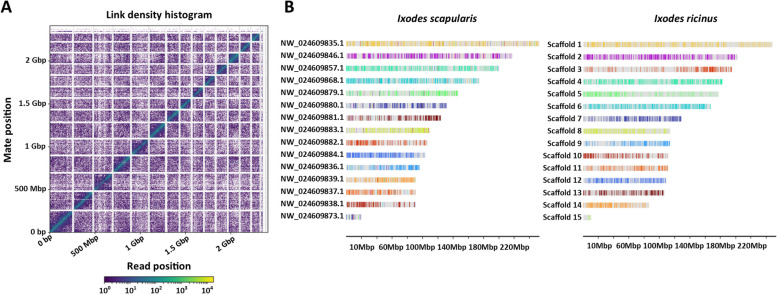
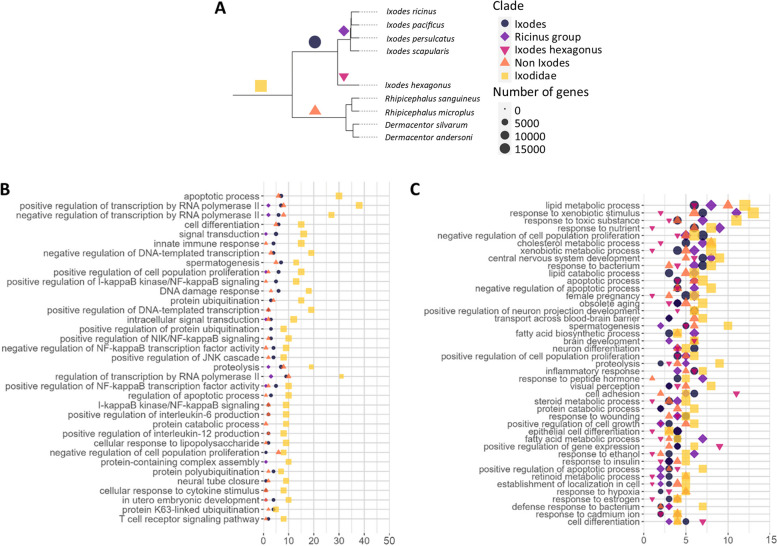
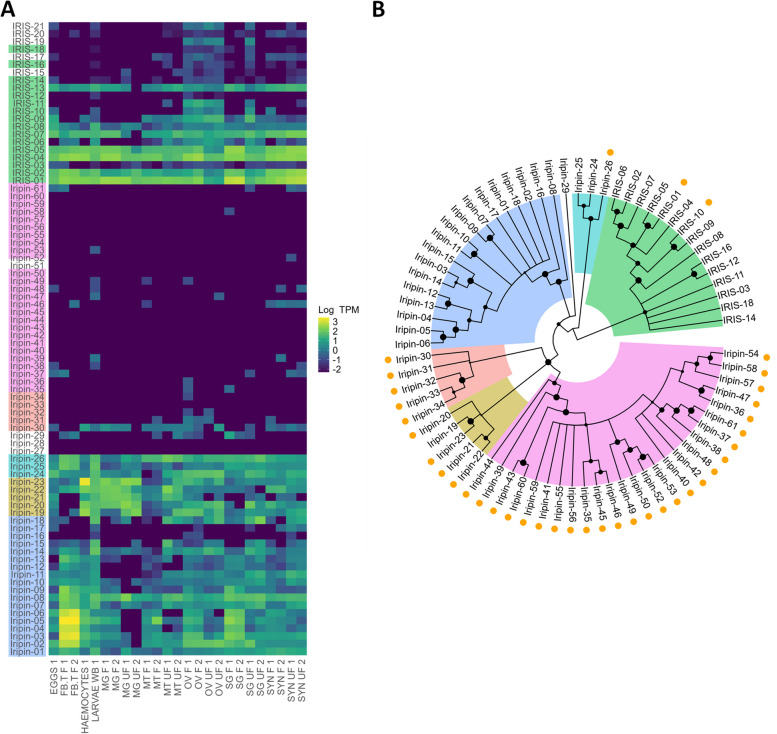
Results: Here, we present the genome sequences of four tick species, derived from a single female individual, with a particular focus on the European species Ixodes ricinus, achieving a chromosome-level assembly. Additionally, draft assemblies were generated for the three other Ixodes species, I. persulcatus, I. pacificus, and I. hexagonus. The quality of the four genomes and extensive annotation of several important gene families have allowed us to study the evolution of gene repertoires at the level of the genus Ixodes and of the tick group. We have determined gene families that have undergone major amplifications during the evolution of ticks, while an expression atlas obtained for I. ricinus reveals striking patterns of specialization both between and within gene families. Notably, several gene family amplifications are associated with a proliferation of single-exon genes-most strikingly for fatty acid elongases and sulfotransferases.

Conclusions: The integration of our data with existing genomes establishes a solid framework for the study of gene evolution, improving our understanding of tick biology. In addition, our work lays the foundations for applied research and innovative control targeting these organisms.

Keywords: Comparative genomics; Duplication; Hematophagy; Parasite; Retroposition.


Conflict of interest statement

Declarations. Ethics approval and consent to participate: The use of vertebrate animals (mice and rabbits) to maintain the I. ricinus colony at the University of Neuchâtel was performed following the Swiss legislation on animal experimentation. The commission that is part of the “Service de la Consommation et des Affaires Vétérinaires (SCAV)” of the canton of Vaud, Switzerland, evaluated and approved the ethics of this part of the study. The SCAV of the canton of Neuchâtel, Switzerland, issued the animal experimentation permit (NE05/2014). Consent for publication: Not applicable. Competing interests: The authors declare no competing interests.

Figures

Fig. 1
Fig. 1
Continuity of the I. ricinus genome assembly and synteny with the I. scapularis genome. A Hi-C map of interactions for the I. ricinus genome assembly, showing 14 major scaffolds. The x and y axes give the mapping positions of the first and second read in the read pair respectively, grouped into bins. The color of each square gives the number of read pairs within that bin. Scaffolds less than 1 Mb are excluded. B Synteny between the genomes of I. scapularis and I. ricinus. Only the 15 largest scaffolds are represented for both species (the haploid chromosome number being 14). Horizontal bars represent the major scaffolds of each genome, while syntenies between the two species are indicated by identical colors
Fig. 2
Fig. 2
Evolutionary dynamics of gene families in ticks. A Distribution of gene families in ticks and other Chelicerata. The top bar plot represents the number of families shared in a given intersection; the left bar plot gives the number of families per species. Species were ordered according to their phylogeny (right tree), and intersections with a phylogenetic relevance are indicated in orange. Tick (Ixodida) species are highlighted in green. B Phylogenetic tree of Chelicerata, based on complete genomes. The tree was built by IQ-TREE 2 using a concatenation of 107 single-copy protein sequences, shared by all represented species. Branch support is shown by bootstrap values and Shimodaira-Hasegawa approximate likelihood ratio test (SH-aLRT) values. C Gene expansion and contraction dynamics in Chelicerata, analyzed with CAFE. The expansion rate per node is given by the size and the color of the points. The number of expanding ( +) or contracting ( −) gene families for each node is in blue and above the branches. The number of new families per node is in green. The tree was built by IQ-TREE 2 using 107 protein sequences, before being transformed into an ultrametric tree using phytools and ape R packages
Fig. 3
Fig. 3
Enriched gene ontology terms (GOs) in gained and expanded families during the evolution of ticks. A phylogenetic tree of the tick species (extracted from the complete phylogenetic tree of Chelicerata). The “non Ixodidae” clade refers to the Metastriata species. The “ricinus group” is a group of closely related Ixodes species. B and C show the most represented Gene Ontology terms associated with biological processes in gained and expanded families, respectively
Fig. 4
Fig. 4
Evolution of serpins in the tick I. ricinus. A Serpin expression profile. The expression heatmap is based on log10(TPM) (transcripts per million) calculated for the respective transcriptomes: SYN, synganglion; SG, salivary glands; OV, ovary; MT, Malpighian tubules; MG, midgut; FB.T, fat body/trachea; UF, unfed females; F, fully fed females; WB, whole body. B Consensus phylogenetic tree of serpins from I. ricinus. Sequences were aligned as proteins; signal peptides and variable reactive center loops were removed before the analysis as well as non-informative positions. Edited protein sequences were analyzed by maximum likelihood method and JTT matrix-based model, and bootstrap method with 1000 replications was used to calculate the reliability of tree branches. Only branches with bootstrap value equal or higher than 50% are shown. Mono-exonic serpins are shown with an orange dot. Specific clades are represented by colored areas in the phylogenetic tree, using the same background color for sequence labels in the heatmap
Fig. 5
Fig. 5
Genomic prediction for heme and iron biology. A Gene loss in the heme biosynthesis pathway in the genome of I. ricinus. The green color indicates the presence of the homologous gene in the I. ricinus genome, with predicted mitochondrial targeting of their protein products (DeepLoc8 prediction values in purple are shown below the enzyme name). B Two ferritin genes have been identified in the I. ricinus genome: ferritin 1 contains 5′ UTR iron-responsive element with the “head” part of the stem-loop structure and complementary bases forming the stem (the blue inset), while ferritin 2 contains a signal peptide (the orange inset) with high SignalP9 probability (shown above the inset). The 3-D reconstruction confirms the conservation of monomeric folding and assembly towards a 24-mer multimers of > 10 nm in external diameter
Fig. 6
Fig. 6
Multiple sequence alignment and tissue expression heatmap of identified I. ricinus prepro-defensins and defensin-like peptides. A Multiple amino-acid sequence alignment of identified prepro-defensins (def1-def14) and defensin-like peptides (DLP1-DLP8). Highlighted in yellow—genes located on scaffold 7; in blue—genes located on scaffold 9; in green—genes located on scaffold 6; red letters—furin cleavage motif; red dashed frame—predicted mature peptides; #—conserved cysteine residues. B Tissue expression heatmap based on TPM (transcripts per million) in respective transcriptomes using log transformation log10(TPM). SYN, synganglion; SG, salivary glands; OV, ovary; MT, Malpighian tubules; MG, midgut; FB.T, fat body/trachea; UF, unfed females; F, fully fed females; WB, whole body
Fig. 7
Fig. 7
Expansion of the cytosolic sulfotransferases (SULTs) in the genome of ticks and other Chelicerata, with evidence for both retroposition events and re-exonization. A Phylogenetic tree of cytosolic sulfotransferases (SULTs). ML tree using the best-fit LG + I + G4 model of substitution. Label prefixes correspond to each species: the tick I. ricinus (SFT, labels in blue), the spider Parasteatoda tepidariorum (ptepid), the horse-shoe crab Limulus polyphemus (limulus), human and Drosophila melanogaster (dmel). Well supported nodes are indicated by dark-filled circles (the width of circles varies with bootstrap values, ranging between 0.85 and 1). The chromosomal localization (scaffold number) is indicated in the first outer circle. The next outer circle are bar-charts of the number of coding exons (dark-gray filling) and 5′ UTR-only exons (orange filling). The tree allows to define two “conserved” clades (A—green and B—red), with sequences shared between vertebrates and Chelicerata, and a clade (C—blue) with sequences exclusively in Chelicerata. B Heatmap of expression of SULTs in I. ricinus

Similar articles

Cited by

References

    1. Jongejan F, Uilenberg G. The global importance of ticks. Parasitology. 2004;129:S3-14. - PubMed
    1. Mans BJ, de Castro MH, Pienaar R, de Klerk D, Gaven P, Genu S, et al. Ancestral reconstruction of tick lineages. Ticks Tick-Borne Dis. 2016;7:509–35. - PubMed
    1. Dunlop JA. Geological history and phylogeny of Chelicerata. Arthropod Struct Dev. 2010;39:124–42. - PubMed
    1. Sharma PP, Kaluziak ST, Pérez-Porro AR, González VL, Hormiga G, Wheeler WC, et al. Phylogenomic interrogation of Arachnida reveals systemic conflicts in phylogenetic signal. Mol Biol Evol. 2014;31:2963–84. - PubMed
    1. Lozano-Fernandez J, Tanner AR, Giacomelli M, Carton R, Vinther J, Edgecombe GD, et al. Increasing species sampling in chelicerate genomic-scale datasets provides support for monophyly of Acari and Arachnida. Nat Commun. 2019;10:2295. - PMC - PubMed

LinkOut - more resources