. 2025 Apr;292(8):2017-2050.
doi: 10.1111/febs.17407. Epub 2025 Jan 21.

Succinate receptor 1 signaling mutually depends on subcellular localization and cellular metabolism

Affiliations

Succinate receptor 1 signaling mutually depends on subcellular localization and cellular metabolism

Aenne-Dorothea Liebing et al. FEBS J. 2025 Apr.

Abstract

Succinate is a pivotal tricarboxylic acid cycle metabolite but also specifically activates the Gi- and Gq-coupled succinate receptor 1 (SUCNR1). Contradictory roles of succinate and succinate-SUCNR1 signaling include reports about its anti- or pro-inflammatory effects. The link between cellular metabolism and localization-dependent SUCNR1 signaling qualifies as a potential cause for the reported conflicts. To systematically address this connection, we used a diverse set of methods, including several bioluminescence resonance energy transfer-based biosensors, dynamic mass redistribution measurements, second messenger and kinase phosphorylation assays, calcium imaging, and metabolic analyses. Different cellular metabolic states were mimicked using glucose (Glc) or glutamine (Gln) as available energy substrates to provoke differential endogenous succinate (SUC) production. We show that SUCNR1 signaling, localization, and metabolism are mutually dependent, with SUCNR1 showing distinct spatial and energy substrate-dependent Gi and Gq protein activation. We found that Gln-consumption associated with a higher rate of oxidative phosphorylation causes increased extracellular SUC concentrations, accompanied by a higher rate of SUCNR1 internalization, reduced miniGq protein recruitment to the plasma membrane, and lower Ca2+ signals. In Glc, under basal conditions, SUCNR1 causes stronger Gq than Gi protein activation, while the opposite is true upon stimulation with an agonist. In addition, SUCNR1 specifically interacts with miniG proteins in endosomal compartments. In THP-1 cells, polarized to M2-like macrophages, endogenous SUCNR1-mediated Gi signaling stimulates glycolysis, while Gq signaling inhibits the glycolytic rate. Our results suggest that the metabolic context determines spatially dependent SUCNR1 signaling, which in turn modulates cellular energy homeostasis and mediates adaptations to changes in SUC concentrations.

Keywords: SUCNR1; macrophages; metabolism; signal transduction; succinate.


Conflict of interest statement

The authors declare no conflict of interest.

Figures
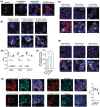
Fig. 1
Fig. 1
Subcellular distribution of SUCNR1 and dynamin‐2‐dependent internalization. (A) HEK293‐T cells were transfected with N‐terminally HA‐ and C‐terminally FLAG‐tagged SUCNR1 or C‐terminally mRuby‐tagged SUCNR1 (red). Cells were fixed and permeabilized as indicated. The N terminal HA‐tag was detected with a monoclonal anti‐HA antibody produced in mouse (1 : 1000), the C‐terminal FLAG‐tag with a monoclonal anti‐FLAG antibody produced in mouse (1 : 400), and a secondary Alexa Fluor555‐labeled (red) anti‐Mouse IgG antibody produced in goat (1 : 500). HEK293‐T cells were co‐transfected for confocal imaging with (B) SUCNR1‐mRuby, (C) Y2R‐mRuby, or (D) M3R‐mRuby (all red) and mVenus‐tagged marker proteins (cyan). (E) Co‐localization of each receptor with the respective subcellular marker was determined using the Pearson correlation coefficient (PCC) for n = 4 representative images (mean ± SEM). (F) Cell surface ELISA in HEK293‐T cells transiently co‐transfected with HA‐tagged SUCNR1 and with dynamin WT or internalization deficient mutants (dyn K44A, dyn R399A). Data are shown as % (mean ± SEM, n = 6) of HA‐tagged SUCNR1 co‐transfected with dynamin WT (OD = 0.096 ± 0.004). (G) Confocal images of transiently SUCNR1‐mRuby (red) transfected HEK293‐T cells were acquired. Cells were fixed, permeabilized and stained with primary anti‐caveolin (1 : 400), anti‐clathrin (1 : 1000), anti‐EEA1 antibody (1 : 100), and secondary antibodies (1 : 500) (anti‐clathrin: Alexa Fluor488 goat anti‐mouse; anti‐caveolin and anti‐EEA1: AlexaFluor488 goat anti‐rabbit). CellMask green plasma membrane stain was diluted 1 : 1000, and cells were imaged live. Co‐localization of SUCNR1‐mRuby with the respective subcellular marker was determined using the Pearson correlation coefficient (PCC) for n = 4 representative images (mean ± SEM). (A–E, G) Cell nuclei were stained with Hoechst 33342 (blue). Representative images of n = 3 experiments are shown, and 10 images were taken per experiment. (E, F) Statistical analyses were performed using an ordinary one‐way ANOVA. # P ≤ 0.1, *P ≤ 0.05, **P ≤ 0.01, ***P ≤ 0.001.
Fig. 2
Fig. 2
Succinate levels depend on the available energy substrate and SUCNR1. (A) Glucose (Glc) and glutamine (Gln) serve as energy substrates to generate succinate (SUC) in the TCA cycle. Gln is converted to glutamate by glutaminase (GLS1), followed by conversion to α‐ketoglutarate (α‐KG). Created with Biorender.com. (B) Gas chromatography–mass spectrometry analyses of SUCNR1‐expressing versus control (CTRL) HEK293‐T cells were performed subsequent incubation for 2 h in PBS with Glc or Gln. SUC concentrations are shown as peak area determined in cell lysates and medium (n = 6, shown as mean ± SD). Absolute SUC quantification was performed if SUC concentrations were sufficiently high and were indicated in μm. (C) RT‐qPCR experiments were performed to measure differences in the mRNA expression of potential SUC transporters in SUCNR1‐expressing versus CTRL HEK293‐T cells (n = 6, reference gene ACTB C q = 16), shown as relative expression x‐fold over CTRL Glc or CTRL Gln as indicated (mean ± SEM). (A, C) Statistical analyses were performed using unpaired two‐tailed t‐tests. *P ≤ 0.05, **P ≤ 0.01, ***P ≤ 0.001.
Fig. 3
Fig. 3
TCA cycle metabolites and succinate dehydrogenase (SDH) inhibitors activate SUCNR1. Left: The TCA cycle is a central mitochondrial metabolic pathway in most eukaryotic cells. Some cells are able to produce itaconate by converting aconitate. Both itaconate and malonate are inhibitors of SDH. Highlighted in red are metabolites that activate SUCNR1. Created with Biorender.com. Right: HEK293‐T cells were transiently transfected with SUCNR1. DMR measurements were performed upon stimulation with increasing concentrations of TCA cycle intermediates (succinate, malate, oxaloacetate, and methylmalonate) or SDH inhibitors (itaconate and malonate). Data are shown as mean ± SEM of n = 3 independent experiments, each carried out in triplicates.
Fig. 4
Fig. 4
Characterization of the synthetic SUCNR1 ligand compound 31. For DMR measurements (A, E each n = 3), cAMP assays (n = 3) (B), and IP1 assays (n = 4) (C), HEK293‐T were transfected with SUCNR1 and stimulated with 100 μm of succinate (SUC), cis‐epoxysuccinate (CES) or compound 31. (D) HEK293‐T cells were transfected with SUCNR1‐mRuby. The fluorescence ratio (F340/F380) represents the time course of calcium responses in SUCNR1‐mRuby transfected (mRuby+) and non‐transfected (mRuby−) cells from the same coverslip. Each trace represents the average calcium signal ± SEM of SUC: 32 cells, CES: 28 cells, 31: 37 cells. The application of ATP (100 μm) served as the stimulus for the endogenous calcium‐releasing pathway. (E) For DMR measurements, cells were incubated overnight with the Gi inhibitor pertussis toxin (PTX) or 30 min before the assay with the Gq inhibitor UBO‐QIC (Ubo). Cells were stimulated with 100 μm SUC, CES, or compound 31. Untreated cells served as control (vehicle, vh). (F) For BRET analyses, HEK293‐T cells were transfected with SUCNR1‐mVenus and arrestin‐3‐Nluc (n = 4). BRET ratios were defined as acceptor emission/donor emission. (A–C, E, F) Data are shown as mean ± SEM of the indicated number of independent experiments, each carried out in triplicates.
Fig. 5
Fig. 5
Evaluation of the SUCNR1 antagonist NF56‐EJ40. For DMR measurements (A, B), IP1 assays (D), cAMP assays (E), and cell surface ELISA (F), HEK293‐T were transfected with SUCNR1. (A) DMR measurements were performed, simultaneously applying cis‐epoxysuccinate (CES) or succinate (SUC) (each 100 μm) and 100 nm of NF56‐EJ40 (n = 4). (B) Cells were pre‐incubated for 30 min with or without the SUCNR1 antagonist 100 nm NF56‐EJ40. Cells were incubated for 16 h before the assay with or without the Gi protein inhibitor pertussis toxin (PTX, 100 ng·mL−1, middle graph). Cells were pre‐incubated for 30 min with or without the Gq protein inhibitor UBO‐QIC (Ubo, 300 nm, right graph) (n = 4). (C) HEK293‐T cells were transfected with SUCNR1‐mRuby. Cells were pre‐incubated for the indicated time with the SUCNR1 antagonist (100 nm NF56‐EJ40) and stimulated with SUC and CES, as shown. The application of ATP (100 μm) served as the stimulus for the endogenous calcium‐releasing pathway. Each trace represents the average calcium signal ± SEM of left: 24 cells, middle: 33 cells, right: 35 cells. (D, E) Cells were pre‐incubated for 30 min with or without (vh) 100 nm NF56 EJ40. (D) As indicated, IP1 accumulation (n = 4) and (E) cAMP inhibition assays (n = 5) were performed by stimulating with SUC or CES. (F) Cell surface ELISA was performed in cells pre‐incubated for 30 min with 100 nm NF56‐EJ40 or without (vh) (n = 3). (G) HEK293‐T cells were transiently co‐transfected with SUCNR1‐mVenus and arrestin‐3‐Nluc. Cells were 30 min pre‐incubated with 100 nm NF56‐EJ40 or without (vh) and stimulated with 200 μm SUC or CES (n = 4). BRET ratios were defined as acceptor emission/donor emission. (D, F, G) Statistical analyses were performed using a one‐way ANOVA and unpaired two‐tailed t‐tests, respectively. (A, B, D–G) All data are shown as mean ± SEM of the indicated number of independent experiments, each carried out in triplicates. *P ≤ 0.05, **P ≤ 0.01, ***P ≤ 0.001.
Fig. 6
Fig. 6
SUCNR1 agonists increase respiratory parameters in SUCNR1‐expressing HEK293 cells in Glucose (Glc). (A) The electron transport chain (ETC) is located in the inner mitochondrial membrane, consisting of several protein complexes, ultimately leading to the production of ATP. Complexes I, III, and IV translocate protons (H+). Complex II is succinate dehydrogenase (SDH). Schematic created using Biorender.com. Oxygen consumption rate (OCR) and extracellular acidification rate (ECAR) were measured with the Seahorse XFe96 extracellular flux analyzer in the presence of 10 mm Glc or 2 mm glutamine (Gln) and different specific inhibitors of the ETC as depicted. Changes in OCR and ECAR over time are depicted for SUCNR1‐expressing cells. (B–F) Cells were stimulated with 200 μm succinate (SUC) or cis‐epoxysuccinate (CES). (B) In Glc, stimulation of SUCNR1‐expressing cells with agonists results in increased respirational parameters, as indicated. (C) In Gln, stimulation with SUC or CES caused a decrease in maximal respiration in SUCNR1‐expressing cells. Stimulation with SUC or CES did not affect basal and maximal respiration of HEK293‐CTRL cells in (D) Glc or (E) Gln. (F) In Glc, stimulation with SUC or CES induced a detectable shift in basal and stressed metabolic phenotype in SUCNR1‐expressing cells, which was absent in CTRL cells. In Gln, a shift in the opposite direction was found in the stressed metabolic phenotype in SUCNR1‐expressing cells. Data are shown as mean ± SEM of n = 3 independent experiments, each carried out in 6 technical replicates. (B, C) Statistical analyses were performed by applying two‐way repeated measures ANOVAs. ***P ≤ 0.001.
Fig. 7
Fig. 7
SUCNR1‐mediated signaling is affected by the availability of different energy substrates, causing differential effects on cellular metabolism. (A–D) Dynamic mass redistribution (DMR) measurements in SUCNR1‐transfected HEK293‐T cells in the presence of Glc or Gln, stimulated with 100 μm succinate (SUC) or cis‐epoxysuccinate (CES). Cells were either untreated (vh), incubated for 16 h before the assay with the Gi protein inhibitor pertussis toxin (PTX, 100 ng·mL−1), or for 30 min before the assay with 300 nm of the Gq protein inhibitor UBO‐QIC (Ubo). Data are shown as mean ± SEM of n = 4 independent experiments. (A, C) Stimulation with SUC in Glc and Gln. (B, D) Stimulation with CES in Glc and Gln. (C, D) Data shown in the absence of inhibitor (vh) was set to 100% in each medium. (E–H) As indicated, BRET assays were performed in cells co‐transfected with Y2R‐Nluc, M3R‐Nluc, or SUCNR1‐Nluc, and mVenus‐tagged miniGi or miniGq protein. (E) Cells were incubated for 30 min in PBS Glc or PBS Gln. (F) Y2R was stimulated with 1 μm neuropeptide Y (NPY) and M3R with 100 μm carbachol (Cch), each serving as a control for Gi and Gq signaling, respectively. (G) SUCNR1 was stimulated with 200 μm SUC or CES with or without preincubation with 100 nm of the SUCNR1 antagonist NF56‐EJ40. (E–G) BRET ratios before and after agonist stimulation are shown as mean ± SEM of n = 3 independent experiments, each carried out in triplicates. Statistical analyses were performed using repeated measures of one‐way ANOVA or paired two‐tailed t‐tests, respectively. (H) BRET ratios for SUC and CES are shown as x‐fold over vehicle (vh) control in Glc and Gln (mean ± SEM, n = 3). Statistical analyses were performed using unpaired two‐tailed t‐tests. BRET ratios were defined as acceptor emission/donor emission. ns, not significant; *P ≤ 0.05, **P ≤ 0.01, ***P ≤ 0.001.
Fig. 8
Fig. 8
SUCNR1‐mediated Gi and Gq signaling depends on the available energy substrates and localization. (A–F) The fluorescence ratio (F340/F380) represents the time course of calcium responses in SUCNR1‐mRuby transfected (mRuby+) and non‐transfected (mRuby−) cells from the same coverslip. Each trace represents the average calcium signal ± SEM of the indicated number of cells. Application of ATP (100 μm) or the sarcoendoplasmic reticulum calcium ATPase blocker cyclopiazonic acid (CPA, 20 μm) served as stimuli for endogenous calcium‐releasing pathways. As indicated, cells were stimulated with succinate (SUC) and cis‐epoxysuccinate (CES) in (A) Glc and, in addition, either (B) incubated for 16 h before the measurement with the Gi protein inhibitor pertussis toxin (PTX, 100 ng·mL−1), or (C) for 30 min before the assay with 300 nm of the Gq protein inhibitor UBO‐QIC (Ubo). (D) Cells were stimulated with SUC or CES in Gln. (E) Calcium signals were quantified using the Δratio(F340/F380) from basal and peak amplitude before and after agonist application (mean ± SD, n = 4) for data shown in (A) and (D). (F) Following incubation in a medium supplemented with 2 mm Gln with or without the glutaminase inhibitor BPTES, cells were stimulated with CES as indicated. Calcium signals were quantified using the Δratio(F340/F380) from basal and peak amplitude before and after agonist application (mean ± SD, n = 3). HEK293‐T were transiently transfected with (G) SUCNR1 and the PIP2 sensor, (H) SUCNR1‐mRuby and arrestin‐3‐YFP, or (I) SUCNR1‐mVenus and arrestin‐3‐Nluc. Assays were performed in PBS with glucose (Glc) or glutamine (Gln). Cells were stimulated with 200 μm SUC or CES as indicated. (G, I) BRET ratios were defined as acceptor emission/donor emission. Data are shown as mean ± SEM of n ≥ 3 independent experiments. (G, I) Statistical analyses with BRET data were performed using paired two‐tailed t‐tests. Statistical analyses of Calcium data were performed using unpaired two‐tailed t‐tests (E, F). Baseline‐corrected BRET data (G, I) was analyzed using a one‐way ANOVA. *P ≤ 0.05, **P ≤ 0.01, ***P ≤ 0.001.
Fig. 9
Fig. 9
SUCNR1‐induced ERK and Akt signaling. Phosphorylated and total levels of ERK (A, C) and Akt1/2/3 (B, D) were measured upon stimulation with 200 μm cis‐epoxysuccinate (CES) in HEK293‐T cells transfected with SUCNR1 or empty vector (CTRL). (A, B) Assays were performed in the absence (vh) and the presence of inhibitors, incubated 16 h prior to the assay with 100 ng·mL−1 of the Gi protein inhibitor pertussis toxin (PTX), or 30 min before the assay with 300 nm of the Gq protein inhibitor UBO‐QIC (Ubo), or 50 μm of the Gβγ inhibitor gallein, or 100 μm barbadin as indicated (n = 3). Barbadin blocks agonist‐promoted arrestin‐dependent and clathrin‐mediated endocytosis. Phosphorylated and total ERK (C) and Akt1/2/3 (D) were measured after cells were incubated for 30 min in PBS with Glc or Gln (n = 5). Statistical analyses were performed using repeated measures of one‐way ANOVA (A, B) or paired two‐tailed t‐tests (C, D), respectively. Data are shown as mean ± SEM of the indicated number of independent experiments, each carried out in triplicates. *P ≤ 0.05, **P ≤ 0.01, ***P ≤ 0.001.
Fig. 10
Fig. 10
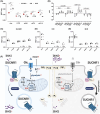
Changes in subcellular distribution of SUCNR1. For BRET analyses, HEK293‐T cells were transiently co‐transfected with SUCNR1‐Nluc, M3R‐Nluc, or Y2R‐Nluc and mVenus‐tagged subcellular marker proteins as indicated. BRET analyses were performed in PBS with glucose. (A) BRET ratios in the absence of agonists in Glc are shown (SUCNR1 mas, FYVE, each n = 12, rab5A, rab7A, rab11A, each n = 15, Y2R and M3R each n = 6). Statistical analyses were performed using an ordinary one‐way ANOVA. (B) Cells were stimulated with 200 μm succinate (SUC), 200 μm cis‐epoxysuccinate (CES), 100 μm carbachol (Cch), or 1 μm neuropeptide Y (NPY) as depicted. BRET ratios were defined as acceptor emission/donor emission, and the area under the curve (AUC) was extrapolated (SUCNR1 mas, FYVE, each n = 4, rab5A, rab7A, rab11A, each n = 5, Y2R and M3R each n = 3). BRET ratios in the absence of agonists comparing Glc versus Gln are shown for (C) SUCNR1 (mas, FYVE, each n = 12, rab5A, rab7A, rab11A, each n = 15), (D) Y2R (n = 6), and (E) M3R (n = 8). Statistical analyses were performed using paired two‐tailed t‐tests. ns, not significant; **P ≤ 0.01, ***P ≤ 0.001. Data are shown as mean ± SEM. (F) Graphical summary of findings on SUCNR1 signal transduction and influence on cellular metabolism depending on the available energy substrate. Created with Biorender.com.
Fig. 11
Fig. 11
Differential miniGi and miniGq protein recruitment by SUCNR1 dependent on subcellular compartments. For confocal imaging, HEK293‐T cells were transfected with (A) miniGi or (B) miniGq protein‐mVenus variants (green) or (C) both as indicated. Cell nuclei were stained with Hoechst 33342 (blue). (A, B) Representative images of n = 3 experiments are shown, and 5 images were taken per experiment. (C) Expression was quantified as green fluorescence using the Celigo Imaging Cytometer (n = 3, 3 replicates per experiment). As indicated, BRET assays were performed in cells co‐transfected with (D) Y2R‐Nluc, M3R‐Nluc (number of independent experiments as indicated in the figure), or (E‐H) SUCNR1‐Nluc, and mVenus‐tagged miniG protein variants (all n = 6). (D–H) BRET analyses were performed in PBS Glc. (D) Y2R was stimulated with 1 μm neuropeptide Y (NPY) and M3R with 100 μm carbachol (Cch), each serving as a control for Gi and Gq signaling, respectively. (E–H) SUCNR1 was stimulated with 200 μm succinate (SUC) or cis‐epoxysuccinate (CES) with or without preincubation with 100 nm of the SUCNR1 antagonist NF56‐EJ40. (E‐H) BRET ratios before and after agonist stimulation are shown, and for SUCNR1, BRET ratios for SUC and CES are additionally shown as x‐fold over vehicle (vh) control. (E) mas, (F) FYVE, (G) rab5A, and (H) rab7A miniGi and miniGq protein variants. BRET ratios were defined as acceptor emission/donor emission. Data are shown as mean ± SEM. Statistical analyses of BRET ratios were performed using (C) unpaired two‐tailed t‐tests, (D) paired two‐tailed t‐tests, or (E, F) repeated measures one‐way ANOVA for BRET ratio data (left graph), respectively. (E, F) Statistical analyses of fold‐change BRET (right graph) were performed using unpaired two‐tailed t‐tests. ns, not significant; # P ≤ 0.1, *P ≤ 0.05, **P ≤ 0.01, ***P ≤ 0.001.
Fig. 12
Fig. 12
Biosensors for GTP‐bound Gα proteins and free Gβγ proteins in different subcellular compartments. HEK293‐T cells were co‐transfected with (A) Y2R or M3R or (B) SUCNR1 and components constituting compartmentalized biosensors: KB1753‐Nluc and Gαi‐YFP or GRK2RH‐Nluc and Gαq‐mVenus or GRK3ct‐Nluc, Gβγ‐mVenus and Gαi or GRK3ct‐Nluc, Gβγ‐mVenus and Gαq. The Nluc‐tagged biosensors were modified with mas, FYVE, or rab7A. BRET analyses were performed in PBS Glc. (A) Y2R was stimulated with 1 μm neuropeptide Y (NPY). M3R with 100 μm carbachol (Cch). (B) SUCNR1 was stimulated with 200 μm succinate (SUC) or cis‐epoxysuccinate (CES). (A, B) BRET ratios before and after agonist stimulation are shown. The number of experiments is indicated in the graphs. (C) Nluc luminescence of the compartmentalized biosensors of the experiments depicted in (A, B) is shown as box and whiskers min to max, line at mean. Statistical analyses were performed using (A) paired two‐tailed t‐tests or (B) repeated measures one‐way ANOVA. ns, not significant; # P ≤ 0.1, *P ≤ 0.05, **P ≤ 0.01, ***P ≤ 0.001. (D) Under basal conditions, SUCNR1 in FYVE preferentially recruits miniGq, and in rab7A preferentially miniGi. When stimulated with an agonist, the opposite is true. (E) Under basal conditions, SUCNR1 leads to more active (GTP‐bound) Gαq than Gαi. Agonist stimulation increases active (GTP‐bound) Gαi. (F) SUCNR1 has two succinate binding sites [44]. We hypothesize that low SUC concentrations stabilize a Gq protein‐activating conformation of SUCNR1 (only one SUC molecule is bound), while high SUC concentrations stabilize a Gi protein‐activating SUCNR1 conformation with two SUC molecules bound. Depending on the intra‐ and extracellular SUC levels, SUCNR1 preferentially activates Gq or Gi proteins from the plasma membrane or endosomes. (D–F) Created with Biorender.com.
Fig. 13
Fig. 13
THP‐1‐derived M1‐ and M2‐like macrophages functionally express SUCNR1. (A) The mRNA expression levels of markers for M1‐ and M2‐like macrophages and SUCNR1 are shown as ΔC q‐values for THP‐1 cells differentiated to M0‐, M1‐, or M2‐like macrophages (n = 3, reference gene ACTB C q = 16). (B) Dynamic mass redistribution (DMR) responses in M1‐ and M2‐like macrophages upon stimulation with 200 μm cis‐epoxysuccinate (CES) with or without pertussis toxin (PTX, 100 ng·mL−1, 16 h), or UBO‐QIC (Ubo, 300 nm, 30 min) pre‐incubation (n = 3). (C) cAMP inhibitory signaling (M1: n = 3, M2: n = 5) (D) and intracellular IP1 levels (n = 3) in response to 200 μm cis‐epoxysuccinate (CES) with or without pertussis toxin (PTX, 100 ng·mL−1, 16 h) or UBO‐QIC (Ubo, 300 nm, 30 min) pre‐incubation. (E) Phosphorylation of endogenous ERK (n = 6) and Akt1/2/3 (n = 6) in cellular lysates of M2‐like macrophages stimulated with 200 μm CES with or without pertussis toxin (PTX, 100 ng·mL−1, 16 h) or UBO‐QIC (Ubo, 300 nm, 30 min) pre‐incubation. (A–E) Data are shown as mean ± SEM. Statistical analyses were performed using (A) unpaired two‐tailed t‐tests or (C–E) paired two‐tailed t‐tests (comparing unstimulated versus CES for each condition) or repeated measures one‐way ANOVA (comparing vh versus PTX and Ubo‐treated), respectively. ns, not significant; # P ≤ 0.1, *P ≤ 0.05, **P ≤ 0.01, ***P ≤ 0.001.
Fig. 14
Fig. 14
THP‐1‐derived M1 and M2‐like macrophages exhibited SUCNR1‐specific Gi‐ and Gq signaling. (A) M1‐ and M2‐like macrophages were transfected with a red‐fluorescent siRNA, stained Hoechst 33342 (blue), and CellMask plasma membrane stain (cyan) for confocal imaging. Representative images of n = 3 experiments are shown. (B) THP‐1‐derived M1‐ or M2‐macrophages were transfected with two different SUCNR1‐specific siRNAs or siNC (negative Ctrl siRNA), which caused at least ~ 50% reduction in SUCNR1 mRNA levels as detected using RT‐qPCR. (n = 3, reference gene ACTB C q = 18.3) (C) Phosphorylation of endogenous ERK (n = 6) and AKT1/2/3 (n = 6) in cellular lysates of M2‐like macrophages stimulated with 200 μm CES with (siSUCNR1‐I/‐II) or without (siNC) knock‐down of SUCNR1. (D) cAMP inhibitory signaling (M1: n = 3, M2: n = 5) and (E) intracellular IP1 levels (n = 3) in response to 200 μm cis‐epoxysuccinate (CES) with (siSUCNR1‐I/‐II) or without (siNC) knock‐down of SUCNR1. Data are shown as mean ± SEM. Statistical analyses were performed by applying paired two‐tailed t‐tests. ns, not significant; # P ≤ 0.1, *P ≤ 0.05, **P ≤ 0.01, ***P ≤ 0.001.
Fig. 15
Fig. 15
SUCNR1 in THP‐1‐derived M1‐ and M2‐like macrophages regulates cellular metabolism. Oxygen consumption rate (OCR) and extracellular acidification rate (ECAR) were measured with the Seahorse XFe96 extracellular flux analyzer in the presence of 10 mm glucose (Glc) or 2 mm glutamine (Gln), stimulated with 200 μm cis‐epoxysuccinate (CES) and pre‐incubated with or without pertussis toxin (PTX, 100 ng·mL−1, 16 h), or UBO‐QIC (Ubo, 300 nm, 30 min). (A) THP‐1‐M1: basal and maximal OCR in Glc. (B) THP‐1‐M1: basal and maximal ECAR in Glc. (C) THP‐1‐M1: basal and maximal OCR in Gln. (D) THP‐1‐M1: basal and maximal ECAR in Gln. (E) THP‐1‐M2: basal and maximal OCR in Glc. (F) THP‐1‐M2: basal and maximal ECAR in Glc. (G) THP‐1‐M2: basal and maximal OCR in Gln. (H) THP‐1‐M2: basal and maximal ECAR in Gln. OCR and ECAR are depicted as mean ± SEM of n = 3 independent experiments, each carried out in six technical replicates. Statistical analyses were performed using a two‐way repeated measures ANOVA. *P ≤ 0.05, **P ≤ 0.01, ***P ≤ 0.001.
Fig. 16
Fig. 16
Graphical summary of findings on SUCNR1 signal transduction and effect on metabolism in THP‐1‐derived M2‐like macrophages. (A) M2‐like macrophages functionally express SUCNR1, a Gi‐ and Gq‐coupled receptor that activates ERK and Akt phosphorylation through Gi and inhibits Akt phosphorylation through Gq. (B) SUCNR1 stimulates oxidative phosphorylation (OCR) and glycolytic rate (ECAR) through Gi protein. SUCNR1 inhibits glycolytic rate (ECAR) through Gq protein. Created with Biorender.com.

Similar articles

References

    1. van Diepen JA, Robben JH, Hooiveld GJ, Carmone C, Alsady M, Boutens L, Bekkenkamp‐Grovenstein M, Hijmans A, Engelke UFH, Wevers RA et al. (2017) SUCNR1‐mediated chemotaxis of macrophages aggravates obesity‐induced inflammation and diabetes. Diabetologia 60, 1304–1313. - PMC - PubMed
    1. Aguiar CJ, Rocha‐Franco JA, Sousa PA, Santos AK, Ladeira M, Rocha‐Resende C, Ladeira LO, Resende RR, Botoni FA, Barrouin Melo M et al. (2014) Succinate causes pathological cardiomyocyte hypertrophy through GPR91 activation. Cell Commun Signal 12, 78. - PMC - PubMed
    1. Sadagopan N, Li W, Roberds SL, Major T, Preston GM, Yu Y & Tones MA (2007) Circulating succinate is elevated in rodent models of hypertension and metabolic disease. Am J Hypertens 20, 1209–1215. - PubMed
    1. Hochachka PW & Dressendorfer RH (1976) Succinate accumulation in man during exercise. Eur J Appl Physiol Occup Physiol 35, 235–242. - PubMed
    1. Grimolizzi F & Arranz L (2018) Multiple faces of succinate beyond metabolism in blood. Haematologica 103, 1586–1592. - PMC - PubMed

LinkOut - more resources