. 2025 Jan 2;15(1):74-87.
doi: 10.21037/qims-24-2411. Epub 2024 Dec 18.

Influences of the second motion probing gradient b-value and T2 relaxation time on magnetic resonance diffusion-derived 'vessel density' (DDVD) calculation: the examples of liver, spleen, and liver simple cyst

Affiliations

Influences of the second motion probing gradient b-value and T2 relaxation time on magnetic resonance diffusion-derived 'vessel density' (DDVD) calculation: the examples of liver, spleen, and liver simple cyst

Zhi-Guo Ju et al. Quant Imaging Med Surg. .

Abstract

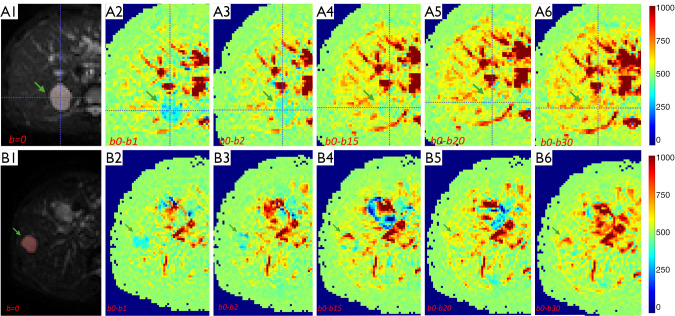
Background: Magnetic resonance (MR) diffusion-derived 'vessel density' (DDVD) is calculated according to: DDVDb0b2 = Sb0/ROIarea0 - Sb2/ROIarea2, where Sb0 and Sb2 refer to the tissue signal when b-value is 0 or 2 s/mm2. Sb2 and ROIarea2 can also be approximated by other low b-values diffusion-weighted imaging (DWI). This study investigates the influence of the second motion probing gradient b-value and T2 on DDVD calculations of the liver, spleen, and liver simple cyst. Literature analysis shows the liver and spleen have very similar amounts of perfusion. At 3T, liver and spleen have a T2 of around 42 and 60 ms respectively, while cyst has a very long T2.

Methods: Twenty-eight subjects had 1.5T DWI data with b-values of 0, 1, 2, 15, 20, 30 s/mm2. Twenty-one subjects had 3.0T DWI data with b-values of 0, 2, 4, 7, 10, 15, 20, 30 s/mm2. DDVDb0b1, DDVDb0b2, DDVDb0b4, DDVDb0b7, DDVDb0b10, DDVDb0b15, DDVDb0b20, and DDVDb0b30 were calculated from b=0 and b=1 images, b=0 and b=2 images, b=0 and b=4 images, b=0 and b=7 images, b=0 and b=10 images, b=0 and b=15 images, b=0 and b=20 images, b=0 and b=30 s/mm2 images, respectively. For liver simple cyst, two cysts totaling six slices scanned at 1.5T were available for DDVD measurement.

Results: At 1.5T, when the second b-value was 1 s/mm2, DDVDspleen value was slightly higher than DDVDliver value; when the second b-value was 2 s/mm2, DDVDliver value was slightly higher than DDVDspleen value. After that, the absolute difference between DDVDliver value and DDVDspleen value became increasingly larger, with DDVDliver value being consistently higher. DDVDcyst showed values close to 0 when the second b-value was 1 s/mm2. When the second b-value was 20 or 30 s/mm2, DDVDcyst value was higher than DDVDliver value. The absolute DDVD values measured higher at 3.0T than at 1.5T. However, the ratio of DDVDspleen to DDVDliver did not apparently differ between 1.5T and 3.0T. From the second b-value being 2 s/mm2 onward, an increasingly larger second b-value was associated with a trend of slow decreasing of the ratio of DDVDspleen to DDVDliver.

Conclusions: When a very low second b-value is applied, the liver and spleen measure similar perfusions by DDVD, and cysts measure DDVD close to zero. When a higher second b-value is applied, relative to the liver, the DDVD of spleen is suppressed while the DDVD of cyst is artificially promoted, which we consider are related to the T2 relaxation times of the liver, spleen, and cyst.

Keywords: Magnetic resonance imaging (MRI); T2 relaxation time; diffusion-derived ‘vessel density’ (DDVD); perfusion.


Conflict of interest statement

Conflicts of Interest: All authors have completed the ICMJE uniform disclosure form (available at https://qims.amegroups.com/article/view/10.21037/qims-24-2411/coif). Y.X.J.W. serves as the Editor-in-Chief of Quantitative Imaging in Medicine and Surgery. G.G. serves as an unpaid editorial board member of Quantitative Imaging in Medicine and Surgery.Y.X.J.W. is the founder of Yingran Medicals Ltd., which develops medical image-based diagnostics software. B.H.X. and M.S.Y.Z. contributed to the development of Yingran Medicals Ltd. The other authors have no conflicts of interest to declare.

Figures

Figure 1
Figure 1
1.5 T liver diffusion weighted images with b-value of 0 (A), 1 (B), 2 (C), 15 s/mm2 (D). Dummy scan (C) was scanned ahead of b=0 image (A). The signal difference between b=0 s/mm2 image and b=1 or 2 s/mm2 images is dramatic, particularly the vessels show high signal when the motion probing gradient is ‘off’ while showing dark signal when the motion probing gradient is ‘on’ even at b=1 s/mm2. The high intensity of the vasculature seen on b=0 s/mm2 image led to the naming of diffusion derived ‘vessel density’.
Figure 2
Figure 2
Fitted data of 1.5T liver and spleen DDVD median values over second b-values, data of 28 subjects (16 males, 12 females) among them two male cases were with liver fibrosis. DDVD, diffusion derived ‘vessel density’.
Figure 3
Figure 3
Fitted data of 1.5T liver, spleen, and liver cyst DDVD median values over second b-values. Liver and spleen data are from 28 subjects. Liver cyst data are based on two cysts totaling six slices from two male patients with liver fibrosis. DDVD, diffusion derived ‘vessel density’.
Figure 4
Figure 4
DDVD appearance of liver cysts (arrow) at 1.5T. b=0 diffusion-weighted imaging (A1,B1) and DDVD pixelwise maps with the second b-value being 1 (A2,B2), 2 (A3,B3), 15 (A4,B4), 20 (A5,B5), and 30 s/mm2 (A6,B6), respectively. Due to the T2 contribution to DDVD values and together with possible misalignment between b=0 image and the second b-value image, typical DDVD appears is lost when second b-value is >15 s/mm2. The cysts were marked with region-of-interest of red color on b=0 diffusion weighted image. DDVD, diffusion derived ‘vessel density’.
Figure 5
Figure 5
Fitted data of liver and spleen DDVD median values over second b-value, 1.5T and 3.0T data. 1.5T data are of 28 subjects (16 males, 12 females), among them two male cases were with liver fibrosis. 3.0T data are of 21 subjects (11 males, 10 females), among them one male case and one female case were with liver fibrosis. DDVD, diffusion derived ‘vessel density’.
Figure 6
Figure 6
Ratios of DDVDspleen to DDVDliver over increasing second b-values, and ratio of spleen ADC to liver ADC from a literature report by Kim et al. (49). From second b-value being 2 s/mm2 onward, an increasingly larger second b-value is associated with a slow decreasing trend of the ratio of DDVDspleen to DDVDliver. Typical ADC data are from Kim et al. (spleen ADC 0.79, liver ADC 1.07×10⁻³ mm2/s, measured at 3.0 T with b-value of 0, 800 s/mm2). The ratio of spleen ADC to liver ADC appears to be in line with the ratio of DDVDspleen to DDVDliver. DDVD, diffusion derived ‘vessel density’; ADC, apparent diffusion coefficient.
Figure 7
Figure 7
DDVD appearance of liver cysts (arrow) at 3.0T (four liver cysts). b=0 diffusion weighted image (A1,B1,C1) and DDVD pixelwise maps with the second b-value being 2 (A2,B2,C2) or 10 (A3,B3,C3) s/mm2, respectively. Liver cysts typically show low DDVD signal. Three cysts were marked with region-of-interest of red color on b=0 diffusion weighted image. DDVD, diffusion derived ‘vessel density’.
Figure 8
Figure 8
DDVD appearance of liver cysts (arrow) at 1.5T. b=0 diffusion weighted imaging (A1,B1) and DDVD pixelwise maps with the second b-value being 1 (A2,B2), 2 (A3,B3), 15 (A4,B4), 20 (A5,B5), and 30 s/mm2 (A6,B6), respectively. Together due to the misalignment between b=0 image and the second b-value image and/or the T2 contribution to DDVD values, typical DDVD appearance is lost on A3, A4, A6, B2, B5, B6. DDVD, diffusion derived ‘vessel density’.

References

    1. Wáng YXJ. Living tissue intravoxel incoherent motion (IVIM) diffusion MR analysis without b=0 image: an example for liver fibrosis evaluation. Quant Imaging Med Surg 2019;9:127-33. 10.21037/qims.2019.01.07 - DOI - PMC - PubMed
    1. Yao DQ, Zheng CJ, Deng YY, Lu BL, Lu T, Hu GW, Li XM, Xiao BH, Ma FZ, Sabarudin A, King AD, Wáng YXJ. Potential diverse applications of diffusion-derived vessel density (DDVD) pixel-by-pixel mapping. Quant Imaging Med Surg 2024;14:2136-45. 10.21037/qims-24-164 - DOI - PMC - PubMed
    1. Huang H, Zheng CJ, Wang LF, Che-Nordin N, Wáng YXJ. Age and gender dependence of liver diffusion parameters and the possibility that intravoxel incoherent motion modeling of the perfusion component is constrained by the diffusion component. NMR Biomed 2021;34:e4449. 10.1002/nbm.4449 - DOI - PubMed
    1. Xiao BH, Huang H, Wang LF, Qiu SW, Guo SW, Wáng YXJ. Diffusion MRI Derived per Area Vessel Density as a Surrogate Biomarker for Detecting Viral Hepatitis B-Induced Liver Fibrosis: A Proof-of-Concept Study. SLAS Technol 2020;25:474-83. 10.1177/2472630320915838 - DOI - PubMed
    1. Hu GW, Zheng CJ, Zhong WX, Zhuang DP, Xiao BH, Wáng YXJ. Usefulness of diffusion derived vessel density computed from a simplified IVIM imaging protocol: An experimental study with rat biliary duct blockage induced liver fibrosis. Magn Reson Imaging 2021;84:115-23. 10.1016/j.mri.2021.09.013 - DOI - PubMed

LinkOut - more resources