. 2024 Dec 25;4(1):kyae018.
doi: 10.1093/discim/kyae018. eCollection 2025.

Granulomatous inflammatory responses are elicited in the liver of PD-1 knockout mice by de novo genome mutagenesis

Affiliations

Granulomatous inflammatory responses are elicited in the liver of PD-1 knockout mice by de novo genome mutagenesis

Ilamangai Nagaretnam et al. Discov Immunol. .

Erratum in

Abstract

Introduction: Programmed death-1 (PD-1) is a negative regulator of immune responses. Upon deletion of PD-1 in mice, symptoms of autoimmunity developed only after they got old. In a model experiment in cancer immunotherapy, PD-1 was shown to prevent cytotoxic T lymphocytes from attacking cancer cells that expressed neoantigens derived from genome mutations. Furthermore, the larger number of genome mutations in cancer cells led to more robust anti-tumor immune responses after the PD-1 blockade. To understand the common molecular mechanisms underlying these findings, we hypothesize that we might have acquired PD-1 during evolution to avoid/suppress autoimmune reactions against neoantigens derived from mutations in the genome of aged individuals.

Methods: To test the hypothesis, we introduced random mutations into the genome of young PD-1-/- and PD-1+/+ mice. We employed two different procedures of random mutagenesis: administration of a potent chemical mutagen N-ethyl-N-nitrosourea (ENU) into the peritoneal cavity of mice and deletion of MSH2, which is essential for the mismatch-repair activity in the nucleus and therefore for the suppression of accumulation of random mutations in the genome.

Results: We observed granulomatous inflammatory changes in the liver of the ENU-treated PD-1 knockout (KO) mice but not in the wild-type (WT) counterparts. Such lesions also developed in the PD-1/MSH2 double KO mice but not in the MSH2 single KO mice.

Conclusion: These results support our hypothesis about the physiological function of PD-1 and address the mechanistic reasons for immune-related adverse events observed in cancer patients having PD-1-blockade immunotherapies.

Keywords: PD-1; autoimmunity; genome mutation; granuloma; self-nonself discrimination.


Conflict of interest statement

Y.I. received a research grant from ONO Pharmaceutical Co., LTD. (Osaka, Japan). The other authors declare no conflicts of interest.

Figures
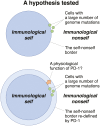
Graphical Abstract
Graphical Abstract
Figure 1.
Figure 1.
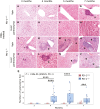
ENU promotes formation of the granuloma lesions in the liver of PD-1 –/– mice. (A–H) Liver tissues from ENU-untreated PD-1+/+ (A–B), ENU-untreated PD-1–/– mice (C–D), ENU-treated PD-1+/+ (E–F), and ENU-treated PD-1–/– mice (G–H) at four months of age (2 months after ENU treatment) were examined by hematoxylin and eosin staining. Representative images of granulomas in the vein (G) and parenchyma (H) regions in the liver tissue of ENU-treated PD-1–/– mice are shown. g(s) stand for granulomas (G–H). (I) The box plot shows numbers of granuloma foci in a liver lobe from ENU-untreated and ENU-treated mice (PD-1+/+ and PD-1–/–). The largest cross sections of four (right lateral, left lateral, right medial, and left medial) liver lobes in every mouse were used in the analysis (N ≥ 8 lobes per ENU-untreated group and N ≥ 16 lobes per ENU-treated group were analyzed). The plot shows the median value (centerline), the first and third quartiles (box boundaries), and the maximum and minimum values within 1.5× the interquartile range (whiskers). Statistical significance was determined by two-tailed Mann–Whitney U test (****P < 0.0001). (J–M) Representative confocal microscopic images of a granuloma in liver tissues from ENU-treated PD-1–/– mice stained with an anti-CD3 antibody (J) and anti-CD11b antibody (K) are shown. Nuclei were counterstained with 4’,6-diamidino-2-phenylindole (DAPI) (L). Images for CD3+ T cells, CD11b+ macrophages, and nuclei are merged (M). Scale bar, 100 µm (A–H, J–M).
Figure 2.
Figure 2.
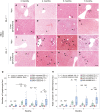
The liver of ENU-treated PD-1 –/– mice begins to develop the granulomatous lesions at 3 to 4 months after birth. (A–P) Liver tissues from ENU-treated PD-1+/+ (A–H) and PD-1–/– mice (I–P) at different time points after birth (1, 2, 3, and 5 months after ENU treatment) were examined by hematoxylin and eosin staining. g(s) represent granulomas (G, K–P) and arrowheads indicate lymphocytic foci (I, J). Scale bar, 100 µm (A–P). (Q) Numbers of granuloma foci in a liver lobe at different time points after birth (1, 2, 3, and 5 months after ENU treatment) are shown. The largest cross sections of four (right lateral, left lateral, right medial, and left medial) liver lobes in every mouse were used for analysis (N ≥ 16 lobes per ENU-treated group). The plot shows the median value (centerline), the first and third quartiles (box boundaries), and the maximum and minimum values within 1.5× the interquartile range (whiskers). Statistical significance was determined by two-way ANOVA and two-tailed Mann–Whitney U test (***P < 0.001, ****P < 0.0001).
Figure 3.
Figure 3.
ENU-treated PD-1 –/– mice show the sign of hepatocytic necrosis. (A–H) Representative histological images of liver tissues from ENU-treated PD-1+/+ mice (A–D) and PD-1–/– mice (E–H) at different time points after birth (1, 2, 3, and 5 months after ENU treatment) are shown. Liver sections were examined by hematoxylin and eosin staining. Arrows indicate dying hepatocytes (sorrounded by infiltrating lymphocytes) in the liver parenchyma regions (B, C, E, F, G, H). Scale bar, 50 µm(A–H). (I) Numbers of single cell necrosis foci in a liver lobe at different time points after birth (1, 2, 3, and 5 months after ENU treatment) are shown. The largest cross sections of four (right lateral, left lateral, right medial, left medial) liver lobes in every mouse were used in the analysis (N ≥ 16 lobes per ENU-treated group). The plot shows the median value (centerline), the first and third quartiles (box boundaries), and the maximum and minimum values within 1.5× the interquartile range (whiskers). Statistical significance was determined by two-way ANOVA and two-tailed Mann–Whitney U test (*P < 0.05, **P < 0.01).
Figure 4.
Figure 4.
The liver of ENU-treated PD-1 –/– mice shows infiltration of mononuclear inflammatory cells. (A–P) Representative histological images of liver tissues from ENU-treated PD-1+/+ mice (A–H) and PD-1–/– mice (I–P) at different time points after birth (1, 2, 3, and 5 months after ENU treatment) are shown. Liver sections were examined with hematoxylin and eosin staining. Arrowheads indicate lymphocytic foci (A–P). Scale bar, 200 µm (A–P). (Q) Numbers of lymphocyte foci in a liver lobe in ENU-untreated and ENU-treated mice (PD-1+/+ and PD-1–/–) at different time points after birth (1, 2, 3, and 5 months after ENU treatment) are shown (N ≥ 8 lobes per ENU-untreated group and N ≥ 16 lobes per ENU-treated group were analyzed). The largest cross sections of four (right lateral, left lateral, right medial, left medial) liver lobes in every mouse were used in the analysis (N ≥ 16 lobes per ENU-treated group). The plot shows the median value (centerline), the first and third quartiles (box boundaries), and the maximum and minimum values within 1.5× the interquartile range (whiskers). Statistical significance was determined by three-way ANOVA and two-tailed Mann–Whitney U test (**P < 0.01, ****P < 0.0001). (R) Total numbers of inflammatory foci in a liver lobe in ENU-untreated and ENU-treated mice (PD-1+/+ and PD-1–/–) at different time points after birth (1, 2, 3, and 5 months after ENU treatment) are shown (N ≥ 8 lobes per ENU-untreated group and N ≥ 16 lobes per ENU-treated group were analyzed). The plot shows the median value (centerline), the first and third quartiles (box boundaries), and the maximum and minimum values within 1.5× the interquartile range (whiskers). Statistical significance was determined by three-way ANOVA and two-tailed Mann–Whitney U test (**P < 0.01, ****P < 0.0001).
Figure 5.
Figure 5.
The global absence of PD-1 and MSH2 in mice induces the development of granulomas in the liver. (A–H) Liver tissues from PD-1+/+MSH2+/+, PD-1–/–MSH2+/+, PD-1+/+MSH2–/–, and PD-1–/–MSH2–/– mice at seven months of age were examined by hematoxylin and eosin staining. Representative images of granulomas observed in the vein (C, G) and parenchyma (H) regions in the liver are shown. g(s) stand for granulomas. (I) The box plot shows the number of granulomas in the liver of PD-1+/+MSH2+/+, PD-1–/–MSH2+/+, PD-1+/+MSH2–/–, and PD-1–/–MSH2–/– mice. The largest cross sections of four (right lateral, left lateral, right medial, and left medial) liver lobes in every mouse were used in the analysis. Numbers of lobes analyzed were: 16 (PD-1+/+MSH2+/+), 24 (PD-1–/–MSH2+/+), 8 (PD-1+/+MSH2–/–), and 24 (PD-1–/–MSH2–/–). The plot shows the median value (centerline), the first and third quartiles (box boundaries), and the maximum and minimum values within 1.5× the interquartile range (whiskers). Statistical significance was determined by two-way ANOVA. (J) Schematic diagram of the parabiosis experiments. In mouse pairs #1, #2, and #3, PD-1–/–, WT, and PD-1–/– mice were surgically connected with target WT, MSH2–/–, and MSH2–/– mice, respectively, and the liver of target mice were analyzed. (K) Numbers of inflammatory foci in a medial liver lobe of target mice in pairs #1, #2, and #3 at 3 to 4 weeks after the surgical connection are shown. The largest cross sections of medial lobes were used in the analysis (N ≥ 3 medial lobes in pairs #1 and #2 and N ≥ 6 medial lobes in pair #3 were analyzed). Data are expressed as means ± SEM. Statistical significance was determined by two-tailed Welch’s t-test (**P < 0.01). (L–O) Representative histological images of liver tissues from target mice of pairs #1 (L), #2 (M), and #3 (N, O) are shown. Liver sections were examined by hematoxylin and eosin staining at 4 weeks after the surgical connection. Arrowheads indicate inflammatory foci (N, O). (P, Q) The liver of target MSH2–/– mice expressing the CD45.2 allo-antigen in pair #3 was analyzed at 3 weeks after the parabiotic connection with PD-1–/– mice expressing the CD45.1 allo-antigen. Representative images of immunohistochemical staining with the anti-CD45.1 monoclonal antibody (P, colored in red) and with the anti-CD45.2 monoclonal antibody (Q, colored in green) are shown. Scale bar, 100 µm (A–H, L–Q).
Figure 6.
Figure 6.
Induced stable expression of exogenous antigens elicits granulomatous inflammatory responses in the liver of PD-1 –/– mice. (A) Schematic diagram of the HDTVi experiments. Only the expression unit inside the SB-transposon vector is shown, and the vector for SB-transposase expression is omitted. (B, C) Representative histological images of liver tissues from PD-1+/+ mice (B) and PD-1–/– mice (C) at 4 weeks after the HDTVi manipulation are shown. Liver sections were examined by hematoxylin and eosin staining. g(s) indicate granuloma foci. Scale bar, 100 µm (B, C). (D-K) Representative confocal microscopic images of the GFP/CD3 signals in liver tissues from PD-1+/+ and PD-1–/– mice stained with an anti-GFP antibody (D, H) and anti-CD3 antibody (E, I) at 4 weeks after the HDTVi manipulation are shown. Nuclei were counterstained with DAPI (F, J). Images for GFP+ cells, CD3+ T cells, and nuclei are merged (G, K). Scale bar, 50 µm (D–K). (L, M, N) Numbers of GFP+ foci (L), total numbers of inflammatory foci (M), and numbers of granuloma foci (N) in a liver lobe of PD-1+/+ and PD-1–/– mice at 4 weeks after the HDTVi manipulation are shown. The largest cross sections of four liver lobes in every mouse were used in the analysis (N ≥ 8 lobes in PD-1+/+ mice and N ≥ 20 lobes in PD-1–/– mice were analyzed). The plot shows the median value (centerline), the first and third quartiles (box boundaries), and the maximum and minimum values within 1.5× the interquartile range (whiskers). Statistical significance was determined by two-tailed Mann–Whitney U test (*P < 0.05, ****P < 0.0001).

Similar articles

References

    1. Ishida Y, Agata Y, Shibahara K, Honjo T.. Induced expression of PD-1, a novel member of the immunoglobulin gene superfamily, upon programmed cell death. EMBO J 1992, 11, 3887–95. doi: https://doi.org/ 10.1002/j.1460-2075.1992.tb05481.x - DOI - PMC - PubMed
    1. Okazaki T, Honjo T.. PD-1 and PD-1 ligands: from discovery to clinical application. Int Immunol 2007, 19, 813–24. doi: https://doi.org/ 10.1093/intimm/dxm057 - DOI - PubMed
    1. Sharpe AH, Pauken KE.. The diverse functions of the PD1 inhibitory pathway. Nat Rev Immunol 2018, 18, 153–67. doi: https://doi.org/ 10.1038/nri.2017.108 - DOI - PubMed
    1. Nishimura H, Nose M, Hiai H, Minato N, Honjo T.. Development of lupus-like autoimmune diseases by disruption of the PD-1 gene encoding an ITIM motif-carrying immunoreceptor. Immunity 1999, 11, 141–51. doi: https://doi.org/ 10.1016/s1074-7613(00)80089-8 - DOI - PubMed
    1. Nishimura H, Okazaki T, Tanaka Y, Nakatani K, Hara M, Matsumori A, et al. Autoimmune dilated cardiomyopathy in PD-1 receptor-deficient mice. Science 2001, 291, 319–22. doi: https://doi.org/ 10.1126/science.291.5502.319 - DOI - PubMed

LinkOut - more resources