. 2025 Jan 7:37:13997.
doi: 10.3389/ti.2024.13997. eCollection 2024.

Impact of Organ Donor Pretreatment With Anti-Thymocyte Globulin in a Murine Model of Allogenic Kidney Transplantation

Affiliations

Impact of Organ Donor Pretreatment With Anti-Thymocyte Globulin in a Murine Model of Allogenic Kidney Transplantation

An He et al. Transpl Int. .

Abstract

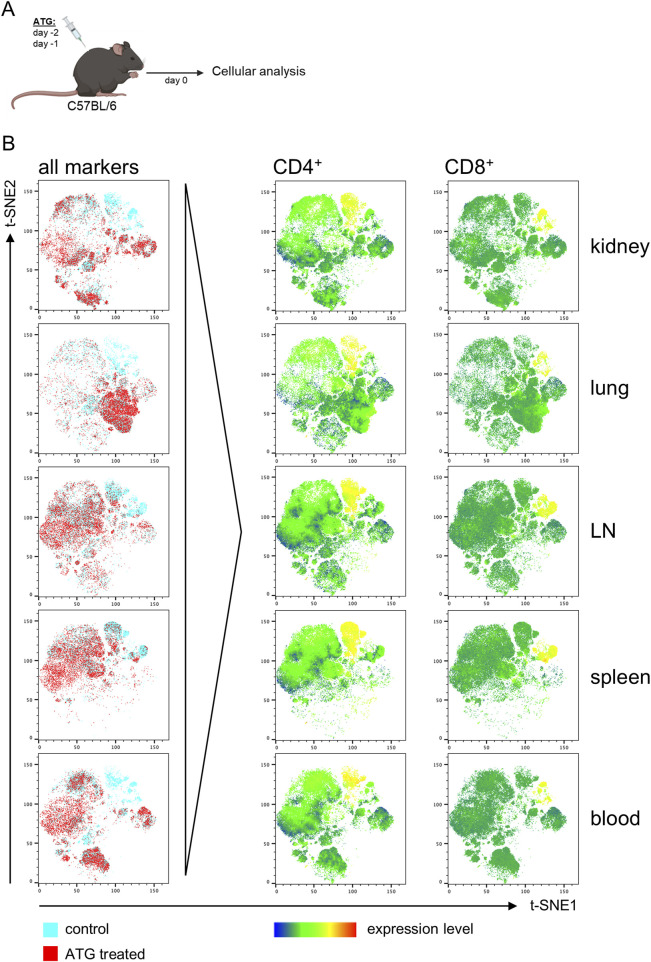
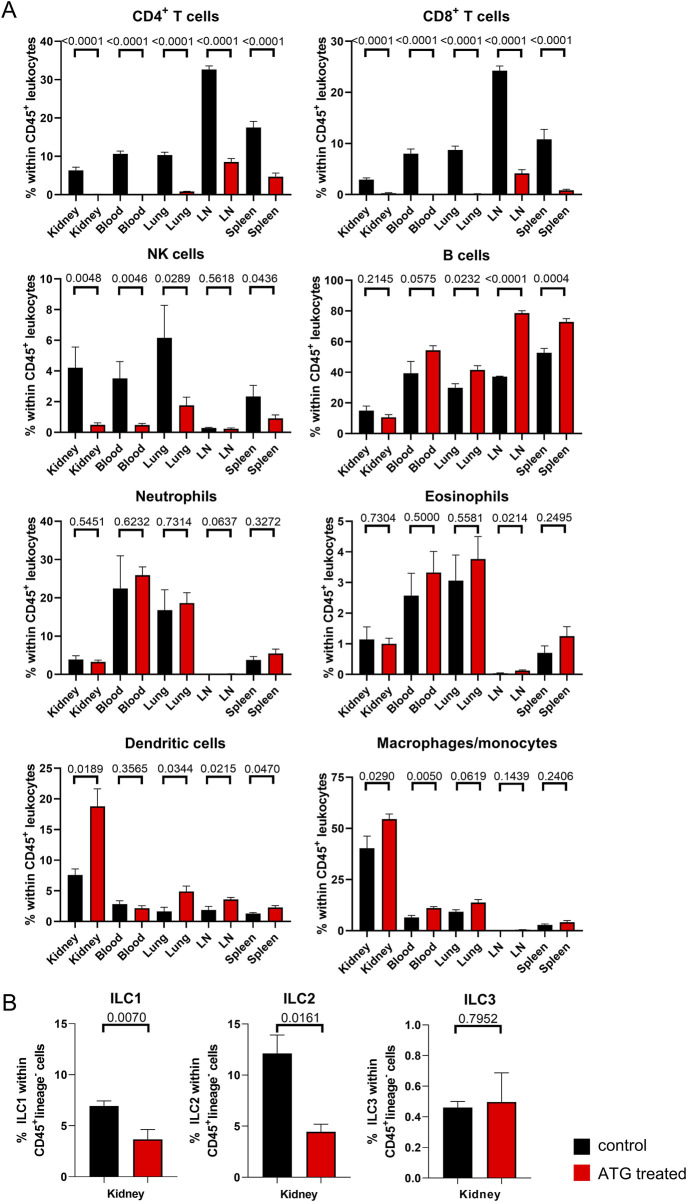
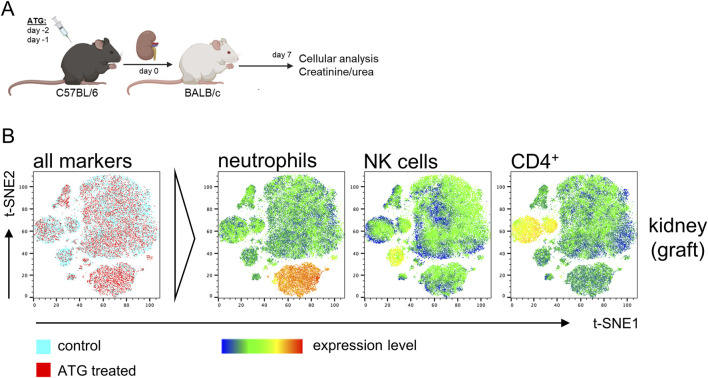
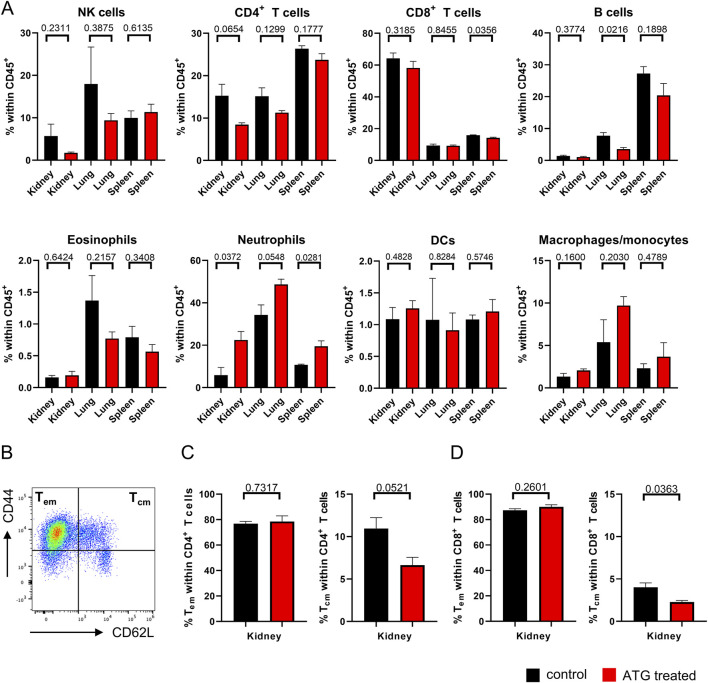
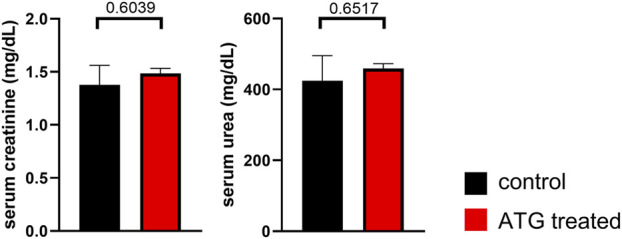
Kidney transplantation is the treatment of choice for end-stage organ failure. To improve transplantation outcomes, particularly of "marginal" organs from extended criteria donors (ECD), attempts have been made to therapeutically modulate donor or graft pre-transplantation. Anti-thymocyte globulin (ATG) has a history as lymphocyte-depleting, immunosuppressive drug for treating rejection episodes post transplantation. In this study, however, we aimed to comprehensively analyze the effects of ATG donor pre-conditioning in a mouse model of kidney transplantation. ATG pre-treatment of potential donors led to a broad depletion of T- and NK cells in peripheral blood, non-lymphoid (including kidney) and lymphoid organs within 48 h, whereas myeloid cells were spared. ATG was also effectively depleting renal innate lymphoid type 1 and 2 cells. Importantly, transplantation of kidneys from ATG pre-treated donors into fully mismatched recipients showed only mild effects on leukocyte re-composition post transplantation. In line with this, serum creatinine and urea levels were similar in animals receiving kidneys from ATG treated donors or controls, demonstrating that donor treatment had no effect on allograft function in the early post-transplantation phase. In summary, our findings are suggestive of a more cell-type-specific depletion strategy in concert with an experimental model better reflecting aspects of clinical transplantation.

Keywords: anti-thymocyte globulin; donor pre-treatment; kidney function; kidney transplantation; passenger leukocytes.


Conflict of interest statement

The authors declare that the research was conducted in the absence of any commercial or financial relationships that could be construed as a potential conflict of interest.

Figures

FIGURE 1
FIGURE 1
ATG-induced T cell depletion across organs in naive mice. (A) Intra-peritoneal ATG treatment scheme of naïve C57BL/6 mice. (B) t-SNE plots of flow cytometric data illustrate separate clustering of cells from the indicated organs derived from control vs. ATG-treated animals. For t-SNE analysis, cells were pre-gated on live CD45+ leukocytes; thereafter, datasets from n = 4–7 animals/group were concatenated. All remaining markers listed in Supplementary Figure S1 were used for clustering. Data from control (blue) and ATG-treated (red) animals were overlaid to identify differences in cluster composition. For prominently different clusters, cellular identity was determined based on expression of the respective lineage markers, thereby e.g., identifying CD4+ and CD8+ T cell depletion in ATG-treated animals.
FIGURE 2
FIGURE 2
Lymphocyte depletion in naive mice after ATG treatment. (A) The indicated leukocyte lineages were quantified by FACS in kidney, blood, lung, lymph node (LN) and spleen in control (con) and ATG-treated (ATG) C57BL/6 animals. (B) Renal composition of type 1, 2 and 3 innate lymphoid cells in control and ATG treated animals. In all experiments, data from both groups were examined for normal distribution. Differences were statistically analyzed by unpaired t- or Mann-Whitney-test, depending on distribution. Bar graphs show the respective means ± SEM. n = 4–8 animals/group, respectively.
FIGURE 3
FIGURE 3
Impact of ATG donor-pretreatment on leukocyte composition in allografts after experimental kidney transplantation. (A) Experimental design and strain combination for murine kidney transplantation in context with intraperitoneal ATG pretreatment of the donor. (B) Exemplary t-SNE plots of flow cytometric data derived from kidney graft samples using the antibody panel shown in Supplementary Figure S1. For t-SNE analysis, renal cells were pre-gated on live CD45+ leukocytes; thereafter, datasets from n = 4–7 animals/group were concatenated. All remaining markers listed in Supplementary Figure S1 were used for clustering. Data from control (blue) and ATG-treated (red) animals were overlaid to identify differences in cluster composition. For prominently different clusters, cellular identity was determined based on expression levels of the respective lineage markers, thereby e.g., identifying increased neutrophil and decreased CD4+ T cell frequencies in kidneys from ATG-treated animals.
FIGURE 4
FIGURE 4
Organ-specific leukocyte composition after kidney transplantation. (A) The indicated leukocyte lineages were quantified by FACS in kidney, lung and spleen in mice receiving allogenic kidney grafts from either control or ATG-pretreated donors. (B) Definition of Tem and Tcm subsets based on the indicated marker combinations. Subset composition in renal (C) CD4+ and (D) CD8+ T cells from mice receiving allogenic kidney grafts of either control and ATG-pretreated donors. In all experiments, data from both groups were examined for normal distribution. Differences were statistically analyzed by unpaired t-oder Mann-Whitney-test, depending on distribution. Bar graphs show the respective means ± SEM. n = 4–7 animals/group.
FIGURE 5
FIGURE 5
Impact of ATG treatment on allograft function. Serum creatinine and urea levels were determined on day 7 after allogenic kidney transplantation in mice receiving grafts of either control or ATG-pretreated donors. Data from both groups were examined for normal distribution. Differences were statistically analyzed by unpaired t-oder Mann-Whitney-test, depending on distribution. Bar graphs show the respective means ± SEM. n = 4–7 animals/group.

Similar articles

References

    1. Metzger RA, Delmonico FL, Feng S, Port FK, Wynn JJ, Merion RM. Expanded Criteria Donors for Kidney Transplantation. Am J Transpl (2003) 3(Suppl. 4):114–25. 10.1034/j.1600-6143.3.s4.11.x - DOI - PubMed
    1. Dahmane D, Audard V, Hiesse C, Pessione F, Bentaarit B, Barrou B, et al. Retrospective Follow-Up of Transplantation of Kidneys From 'Marginal' Donors. Kidney Int (2006) 69:546–52. 10.1038/sj.ki.5000102 - DOI - PubMed
    1. Aubert O, Kamar N, Vernerey D, Viglietti D, Martinez F, Duong-Van-Huyen JP, et al. Long Term Outcomes of Transplantation Using Kidneys From Expanded Criteria Donors: Prospective, Population Based Cohort Study. BMJ (2015) 351:h3557. 10.1136/bmj.h3557 - DOI - PMC - PubMed
    1. Mazeti-Felicio CM, Caldas HC, Fernandes-Charpiot IMM, Dezotti CZ, Baptista M, Abbud-Filho M. Preimplantation Kidney Biopsies of Extended Criteria Donors Have a Heavier Inflammatory Burden Than Kidneys From Standard Criteria Donors. Transpl Direct (2017) 3:e180. 10.1097/TXD.0000000000000671 - DOI - PMC - PubMed
    1. He A, Sarwar A, Thole LML, Siegle J, Sattler A, Ashraf MI, et al. Renal Inflamm-Aging Provokes Intra-Graft Inflammation Following Experimental Kidney Transplantation. Am J Transpl (2022) 22:2529–47. 10.1111/ajt.17154 - DOI - PubMed

LinkOut - more resources