. 2025 Jan 7:18:1523212.
doi: 10.3389/fnins.2024.1523212. eCollection 2024.

Preliminary evaluation of the FastCAP for users of the Nurotron cochlear implant

Affiliations

Preliminary evaluation of the FastCAP for users of the Nurotron cochlear implant

Xue-Ying Yang et al. Front Neurosci. .

Abstract

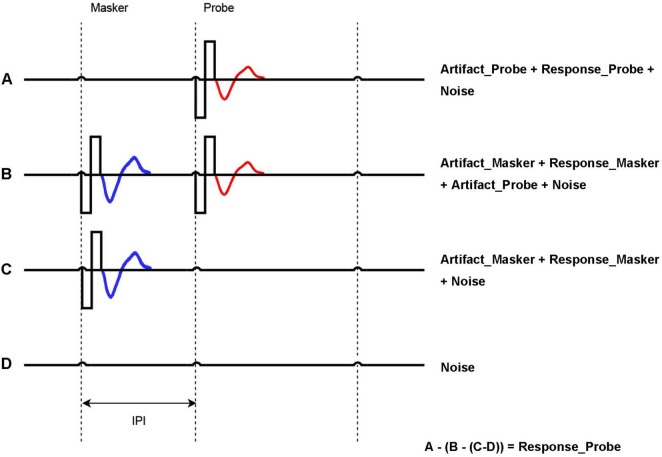
Background: Electrically evoked compound action potential (ECAP) can be used to measure the auditory nerve's response to electrical stimulation in cochlear implant (CI) users. In the Nurotron CI system, extracting the ECAP waveform from the stimulus artifact is time-consuming.

Method: We developed a new paradigm ("FastCAP") for use with Nurotron CI devices. In electrically evoked compound action potential in fast mode (FastCAP), N recordings are averaged directly on the CI hardware before data transmission, significantly reducing data transmission time. FastCAPs and ECAPs were measured across five electrodes and four stimulation levels per electrode. The FastCAP stimulation rate (33.3 Hz) is also faster than the ECAP rate (2.5 Hz).

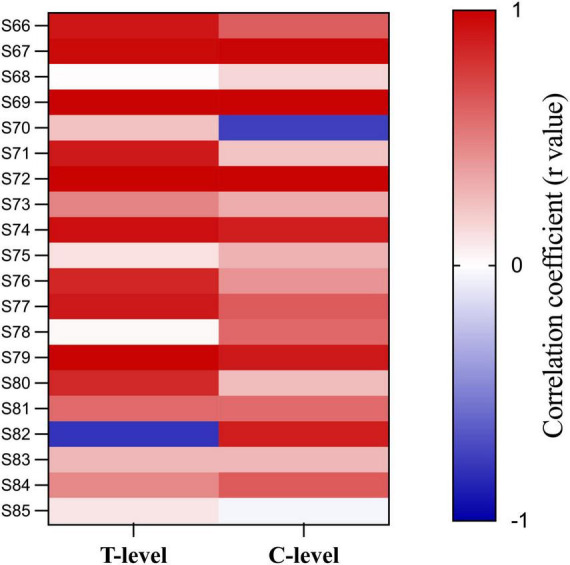
Results: Results showed strong correlations between ECAPs and FastCAPs for N1 latency (r = 0.84, p < 0.001) and N1 amplitude (r = 0.97, p < 0.001). Test-retest reliability for FastCAPs was also high, with intraclass correlation coefficients of r = 0.87 for N1 latency (p < 0.001) and r = 0.96 for N1 amplitude (p < 0.001). The mean test time was 46.9 ± 1.4 s for the FastCAP and 340.3 ± 6.3 s for the ECAP. The FastCAP measurement time was significantly shorter than the ECAP measurement time (W = -210.0, p < 0.001). FastCAP thresholds were significantly correlated with behavioral thresholds in 7/20 participants and with comfortable loudness levels in 11/20 participants. The time required to measure FastCAPs was significantly lower than that for ECAPs. The FastCAP paradigm maintained the accuracy and reliability the ECAP measurements while offering a significant reduction in time requirements.

Conclusion: This preliminary evaluation suggests that the FastCAP could be an effective clinical tool to optimize CI processor settings (e.g., threshold stimulation levels) in users of the Nurotron CI device.

Keywords: Nurotron; cochlear implant; comfortable loudness level; electrically evoked compound action potential; threshold level.


Conflict of interest statement

Q-JF and SH have financial interests at Nurotron Biotechnology Co., Ltd., a medical device company that designs, develops, and markets CI systems. These affiliations are disclosed to ensure transparency and integrity in our research. We confirm that these affiliations did not influence the design, conduct, or reporting of the study. The remaining authors declare that the research was conducted in the absence of any commercial or financial relationships that could be construed as a potential conflict of interest. The reviewer HJ declared a past co-authorship with the author SH.

Figures

FIGURE 1
FIGURE 1
Forward masking approach to acquire ECAP. A = Probe artifact + Probe response (red) + Noise; B = Masker artifact + Masker Response (blue) + Probe response (red) + Probe artifact + Noise; C = Masker artifact + Masker Response (blue) + Noise; D = Noise. Probe response = A − (B − C) − D. The inter-pulse interval (IPI) is the time between Masker and Probe, which is key to generating the masking effect.
FIGURE 2
FIGURE 2
Block diagram of the Nurotron NRM configurable platform. IPG, inter-phase gap; IPI, inter-pulse interval; SR, stimulation rate; SE, stimulating electrode; SR, recording electrode; AT, accumulative time; SAR, successive approximation register; ADC, analog-to-digital converter; AMP, amplifier; Te, access delay; Re, recording electrode; Ts, system delay; Sa, switch for Auto-Zero offset Cancellation Block.
FIGURE 3
FIGURE 3
Schematic illustration of the traditional ECAP (top) and FastCAP method (bottom). In the ECAP, N recordings of A, B, C, and D are transmitted to the PC. In the FastCAP, N recordings are averaged for A, B, C, and D before being transmitted to the PC; D (noise) is only recorded once as it is not expected to change over successive iterations. The red solid lines and gray dashed lines indicate the masker and probe, respectively.
FIGURE 4
FIGURE 4
Example FastCAP (A) and ECAP (B) waveforms for participant 64 on electrode 19 for the four stimulus levels. The ECAP waveforms are color-coded as follows: blue for a stimulus level of 80 CU, orange for 100 CU, red for 120 CU, and green for 140 CU.
FIGURE 5
FIGURE 5
(Top) Evoked compound action potential N1 amplitude as a function of FastCAP N1 amplitude (n = 20). (Bottom) ECAP N1 latency as a function of FastCAP N1 latency. Plots are shown for 80, 100, 120, and 140 CU stimulus presentation levels; data for all participants and all electrodes are shown in each panel. The diagonal lines show unity; values above the line indicate higher values for the ECAP and values below the line indicate higher values for the FastCAP. The mean RMSE between the ECAP and FastCAP values are shown in the top left of each panel.
FIGURE 6
FIGURE 6
(Top) Test 2 FastCAP N1 amplitude as a function of Test 1 FastCAP N1 amplitude (n = 20). (Bottom) Test 2 FastCAP N1 latency as a function of Test 1 FastCAP N1 latency. Plots are shown for 80, 100, 120, and 140 CU stimulus presentation levels; data for all participants and all electrodes are shown in each panel. The diagonal lines show unity; values above the line indicate higher values for Test 2 and values below the line indicate higher values for Test 1. The mean RMSE between the Test 2 and Test 1 values are shown in the top left of each panel.
FIGURE 7
FIGURE 7
FastCAP thresholds, T- and C-levels for individual participants. FastCAP thresholds (black), T-levels (red), and C-levels (green) for individual participants for each of the test electrodes.
FIGURE 8
FIGURE 8
Heat map of the correlation between FastCAP thresholds, T- and C-levels. Each cell represents the correlation coefficient for individual participants.

References

    1. Abbas P. J., Brown C. J., Shallop J. K., Firszt J. B., Hughes M. L., Hong S. H., et al. (1999). Summary of results using the nucleus CI24M implant to record the electrically evoked compound action potential. Ear Hear. 20 45–59. 10.1097/00003446-199902000-00005 - DOI - PubMed
    1. Allam A., Eldegwi A. (2019). Efficacy of using NRT thresholds in cochlear implants fitting, in prelingual pediatric patients. J. Otol. 14 128–135. 10.1016/j.joto.2019.06.002 - DOI - PMC - PubMed
    1. Alvarez I., de la Torre A., Sainz M., Roldán C., Schoesser H., Spitzer P. (2010). Using evoked compound action potentials to assess activation of electrodes and predict C-levels in the Tempo+ cochlear implant speech processor. Ear Hear. 31 134–145. 10.1097/AUD.0b013e3181bdb88f - DOI - PubMed
    1. Biesheuvel J. D., Briaire J. J., Frijns J. H. M. (2018). The precision of eCAP thresholds derived from amplitude growth functions. Ear Hear. 39 701–711. 10.1097/AUD.0000000000000527 - DOI - PubMed
    1. Briaire J. J., Frijns J. H. (2005). Unraveling the electrically evoked compound action potential. Hear. Res. 205 143–156. 10.1016/j.heares.2005.03.020 - DOI - PubMed

LinkOut - more resources