. 2025 Jan 7:15:1404805.
doi: 10.3389/fimmu.2024.1404805. eCollection 2024.

NR2F6 regulates stem cell hematopoiesis and myelopoiesis in mice

Affiliations

NR2F6 regulates stem cell hematopoiesis and myelopoiesis in mice

Johannes Woelk et al. Front Immunol. .

Abstract

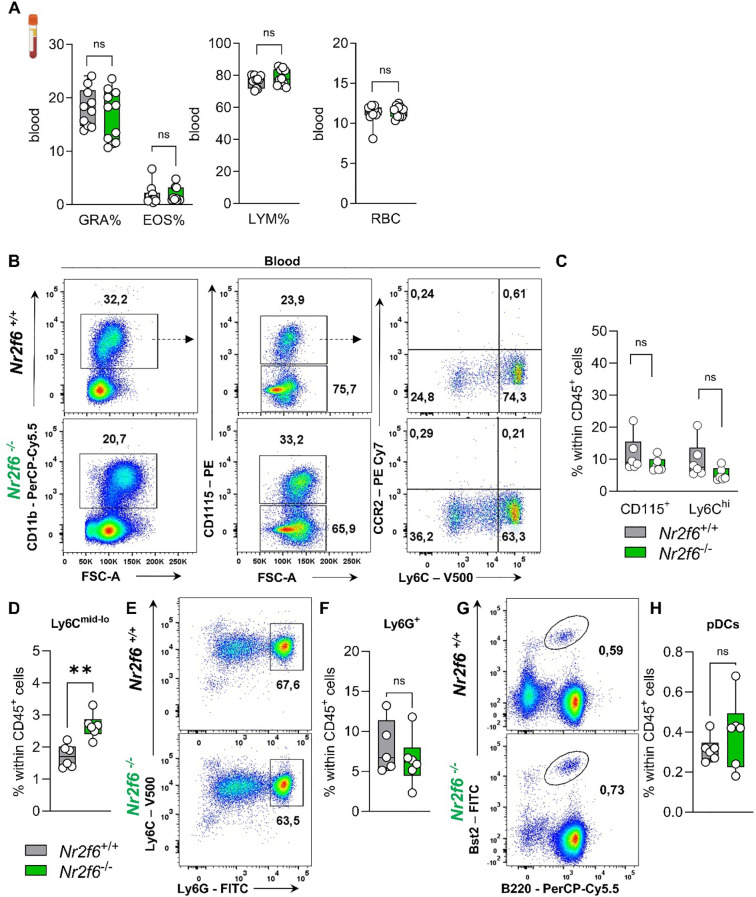
Nuclear receptors regulate hematopoietic stem cells (HSCs) and peripheral immune cells in mice and humans. The nuclear orphan receptor NR2F6 (EAR-2) has been shown to control murine hematopoiesis. Still, detailed analysis of the distinct stem cell, myeloid, and lymphoid progenitors in the bone marrow in a genetic loss of function model remains pending. In this study, we found that adult germline Nr2f6-deficient mice contained increased percentages of total long-term and short-term HSCs, as well as a subpopulation within the lineage-biased multipotent progenitor (MPP3) cells. The loss of NR2F6 thus led to an increase in the percentage of LSK+ cells. Following the differentiation from the common myeloid progenitors (CMP), the granulocyte-monocyte progenitors (GMP) were decreased, while monocyte-dendritic progenitors (MDP) were increased in Nr2f6-deficient bone marrow. Within the pre-conventional dendritic progenitors (pre-cDCs), the subpopulation of pre-cDC2s was reduced in the bone marrow of Nr2f6-deficient mice. We did not observe differences in the development of common lymphoid progenitor populations. Our findings contrast previous studies but underscore the role of NR2F6 in regulating gene expression levels during mouse bone marrow hematopoiesis and myelopoiesis.

Keywords: GMP; HSC; MDP; bone marrow; hematopoiesis; myeloid compartment; nuclear receptor NR2F6; pre-cDC2.


Conflict of interest statement

The authors declare that the research was conducted in the absence of any commercial or financial relationships that could be construed as a potential conflict of interest.

Figures

Figure 1
Figure 1
HSC and MPP development is altered in Nr2f6-deficient bone marrow. (A) Relative Nr2f6 expression normalized by DESeq2 in different bone marrow progenitor populations such as CD34 negative long-term (LT-HSCs CD34-), CD34 positive long-term (LT-HSCs CD34+), and short-term (ST-HSCs CD150-) hematopoietic stem cells, as well as multipotent progenitor (MPP2 CD48+CD150+; MPP3 CD48+ and MPP4 CD135+) populations as defined by the Immgen consortium (55). (B) Representative dot plots of bone marrow-derived live (Lin)CD127-LSK+CD135+CD150- (LMPP), CD135- (HSPC), CD48-CD150+ (LT-HSC), CD48-CD150- (ST-HSC), CD48+CD150+ (MPP2), CD48+CD150- (MPP3) and LMPP derived CD48+CD150- (MPP4) populations from wild-type (Nr2f6 +/+) or Nr2f6-deficient (Nr2f6 -/-) mice. (C-G) Quantification of the percent of parent, percent of total and total cell numbers of live (Lin)CD127- HSPC derived CD48-CD150+ (LT-HSC) (C), CD48-CD150- (ST-HSC) (D), CD48+CD150+ (MPP2) (E), CD48+CD150- (MPP3) (F) and LMPP derived CD48+CD150- (MPP4) (G) populations from wild-type (Nr2f6 +/+) or Nr2f6-deficient (Nr2f6 -/-) mice. (H) Quantification of the CD48 MFI in the MPP2, MPP3 and MPP4 population from wild-type (Nr2f6 +/+) or Nr2f6-deficient (Nr2f6 -/-) mice. Representative data are shown as pooled experiments of at least three independent experiments, total n = 10/9-10 (Nr2f6+/+ )/(Nr2f6-/- ). Each dot represents the data of an individual mouse. Results are shown as mean (A), or median ± IQR, with whiskers from min. to max. Outliers were excluded using ROUT (Q=1%) in GraphPad Prism. The Shapiro-Wilk test evaluated the normality of data. Asterisks indicate statistically significant differences between genotypes calculated using the Student’s t-test or Mann-Whitney U test for non-parametric data. A p-value < 0.05 was considered statistically significant, *0.05, **0.01 (See also Supplementary Figure S1 ).
Figure 2
Figure 2
Loss of NR2F6 induces changes in LSK+ and Sca-1+ cell proportions. (A) Representative dot plots of bone marrow-derived live (Lin)CD127-Sca-1-c-kit (CD117)high and Sca-1+c-kit (CD117)+ (LSK+) positive cell populations together with LSK+ CD135+CD150- (LMPP) and CD135- (HSPC) populations from wild-type (Nr2f6 +/+) or Nr2f6-deficient (Nr2f6 -/-) mice. (B-D) Quantification of the percent of parent, percent of total and total cell numbers of CD135- (HSPC) (B) and CD135+CD150- (LMPP) (C) derived from live (Lin)CD127-Sca-1+c-kit (CD117)+ LSK+ (D) populations from wild-type (Nr2f6 +/+) or Nr2f6-deficient (Nr2f6 -/-) mice. (E) Quantification of the MFI of c-kit (CD117) within LSK+ and Sca-1-c-kit (CD117)high populations and MFI of Sca-1 in LSK+ cells from wild-type (Nr2f6 +/+) or Nr2f6-deficient (Nr2f6 -/-) mice. (F) Quantification of the percent of parent, percent of total and total cell numbers of live (Lin)CD127- Sca-1-c-kit (CD117)high populations from wild-type (Nr2f6 +/+) or Nr2f6-deficient (Nr2f6 -/-) mice. Representative data are shown as pooled experiments of at least three independent experiments, total n = 10/9-10 (Nr2f6+/+ )/(Nr2f6-/- ). Each dot represents the data of an individual mouse. Results are shown median ± IQR with whiskers from min. to max. Outliers were excluded using ROUT (Q=1%) in GraphPad Prism. The Shapiro-Wilk test evaluated the normality of data. Asterisks indicate statistically significant differences between genotypes calculated using the Student’s t-test or Mann-Whitney U test for non-parametric data. A p-value < 0.05 was considered statistically significant, *0.05, **0.01, ***0.001, ****0.0001 (See also Supplementary Figure S2 ).
Figure 3
Figure 3
Development of Nr2f6-deficient myeloid and lymphoid progenitor populations. (A) Representative dot plots of bone marrow-derived live (Lin)-CD127-Sca-1-c-kit (CD117)+CD115- CD16/32+ (GMP), CD16/32-CD34+ (CMP), and CD16/32-CD34- (MEP) cell populations from wild-type (Nr2f6 +/+) or Nr2f6-deficient (Nr2f6 -/-) mice. (B, C) Quantification of the percent of parent, percent of total, total cell numbers and MFI of CD34 of CD16/32-CD34+ (CMP) (B) and CD16/32+ (GMP) (C) within live (Lin)-CD127- Sca-1-c-kit (CD117)+CD115- populations from wild-type (Nr2f6 +/+) or Nr2f6-deficient (Nr2f6 -/-) mice. (D) Histogram of the CD16/32 expression within the GMP population from wild-type (Nr2f6 +/+) or Nr2f6-deficient (Nr2f6 -/-) mice. (E) Quantification of the CD16/32 MFI within the GMP population from wild-type (Nr2f6 +/+) or Nr2f6-deficient (Nr2f6 -/-) mice. (F) Quantification of the percent of parent, percent of total and total cell numbers of CD16/32-CD34- (MEP) within live (Lin)CD127-Sca-1-c-kit (CD117)+CD115- populations from wild-type (Nr2f6 +/+) or Nr2f6-deficient (Nr2f6 -/-) mice. (G) Representative dot plots of bone marrow-derived live (Lin) Sca-1+c-kit (CD117)mid CD135+, CD127+ (CLP) and CD127- (pre-pro NKa) cell populations from wild-type (Nr2f6 +/+) or Nr2f6-deficient (Nr2f6 -/-) mice. (H) Quantification of the percent of parent, percent of total and total cell numbers of live (Lin)Sca-1+c-kit (CD117)lo-int CD127+ (CLP) populations of wild-type (Nr2f6 +/+) or Nr2f6-deficient (Nr2f6 -/-) mice. Representative data are shown as pooled experiments of at least three independent experiments, total n = 10/10 (Nr2f6+/+ )/(Nr2f6-/- ). Each dot represents the data of an individual mouse. Results are shown as median ± IQR with whiskers from min. to max. The Shapiro-Wilk test evaluated the normality of data. Asterisks indicate statistically significant differences between genotypes calculated using the Student’s t-test or Mann-Whitney U test for non-parametric data. A p-value < 0.05 was considered statistically significant, *0.05, **0.01 (See also Supplementary Figure S3 ).
Figure 4
Figure 4
Loss of NR2F6 enhances MDP progenitor populations. (A) Representative dot plots of bone marrow-derived live (Lin)-CD11b- CD115+, c-kit (CD117)+CD135+ (MDP) and c-kit (CD117)intCD135+ (CDP) cell populations from wild-type (Nr2f6 +/+) or Nr2f6-deficient (Nr2f6 -/-) mice. (B, C) Quantification of the percent of parent, percent of total and total cell numbers of live (Lin)-CD11b-CD115+c-kit (CD117)+CD135+ (MDP) (B) and c-kit (CD117)intCD135+ (CDP) (C) populations of wild-type (Nr2f6 +/+) or Nr2f6-deficient (Nr2f6 -/-) mice. (D) Quantification of the CD117 MFI within the MDP population and CD135 MFI within MDP and CDP populations from wild-type (Nr2f6 +/+) or Nr2f6-deficient (Nr2f6 -/-) mice. (E) Quantification of the percent of parent, percent of total and total cell numbers of live (Lin)-CD11b-CD115+c-kit (CD117)+CD135-Ly6C+ common monocyte progenitors (cMoP) populations of wild-type (Nr2f6 +/+) or Nr2f6-deficient (Nr2f6 -/-) mice. (F) Representative dot plots of bone marrow-derived live (Lin)CD11b-CD11c+MHC-II-CD135+CD172a, Ly6C+SiglecH+ and Ly6C-SiglecH+ (pre-DC), as well as Ly6C+SiglecH- (pre-DC cDC2) cell populations from wild-type (Nr2f6 +/+) or Nr2f6-deficient (Nr2f6 -/-) mice. (G-I) Quantification of the percent of parent, percent of total and total cell numbers of live (Lin)CD11b-CD11c+MHC-II-CD135+CD172a- Ly6C-SiglecH+ (pre-DC) (G) Ly6C+SiglecH+ (pre-DC) (H) and Ly6C+SiglecH- (pre-DC cDC2) (I) populations of wild-type (Nr2f6 +/+) or Nr2f6-deficient (Nr2f6 -/-) mice. Representative data are shown as pooled experiments of at least three independent experiments, total n = 11/12 (Nr2f6+/+ )/(Nr2f6-/- ). Each dot represents the data of an individual mouse. Results are shown as median ± IQR with whiskers from min. to max. The Shapiro-Wilk test evaluated the normality of data. Asterisks indicate statistically significant differences between genotypes calculated using the Student’s t-test or Mann-Whitney U test for non-parametric data. A p-value < 0.05 was considered statistically significant, *0.05, **0.01, ***0.001 (See also Supplementary Figures S3 and S4 ).
Figure 5
Figure 5
Cytokines, CFUs, and the myeloid compartment in the bone marrow of Nr2f6-deficient mice. (A) Quantification of G-CSF, M-CSF, and IL-1β concentrations (in pg/ml) in the bone marrow supernatant of wild-type (Nr2f6 +/+) or Nr2f6-deficient (Nr2f6 -/-) mice. (B, C) Quantification of the total CFU count (B) as well as specific colonies (C), derived from the bone marrow in mouse methylcellulose complete media eight days post seeding of wild-type (Nr2f6 +/+) or Nr2f6-deficient (Nr2f6 -/-) mice. (D) Representative dot plots of bone marrow-derived CD45+CD11b+, CD115+, CD115-, Ly6Chi and Ly6Cmid-lo cell populations from wild-type (Nr2f6 +/+) or Nr2f6-deficient (Nr2f6 -/-) mice. (E-H) Quantification of bone marrow-derived CD11b+ (E), CD115+ (F), Ly6Chi (G) and Ly6Cmid-lo (H) cell populations within CD45+ cells from wild-type (Nr2f6 +/+) or Nr2f6-deficient (Nr2f6 -/-) mice. (I-J) Representative dot plots (I) and quantification (J) of bone marrow-derived Bst2+B220+ pDCs within CD45+ cells from wild-type (Nr2f6 +/+) or Nr2f6-deficient (Nr2f6 -/-) mice. Representative data are shown as pooled experiments of two independent experiments, total n = 6/6 (Nr2f6+/+ )/(Nr2f6-/- ) per genotype. Each dot represents the data of an individual mouse. Results are shown as median ± IQR with whiskers from min. to max. The Shapiro-Wilk test evaluated the normality of data. Outliers were excluded using ROUT (Q=1%) in GraphPad Prism. Asterisks indicate statistically significant differences between genotypes calculated using the nested t-test (B, C), Student’s t-test, or Mann-Whitney U test for non-parametric data. A p-value < 0.05 was considered statistically significant, *0.05, **0.01, (See also Supplementary Figure S5 ).
Figure 6
Figure 6
Myeloid compartment in the blood of Nr2f6-deficient mice. (A) Quantification of the percent of granulocytes (GRA%), eosinophils (EOS%) and lymphocytes (LYM) as well as the percent of red blood cells (RBC) in the blood in wild-type (Nr2f6 +/+) or Nr2f6-deficient (Nr2f6 -/-) mice. (B) Representative dot plots of blood-derived CD45+CD11b+, CD115+, CD115-, Ly6Chi and Ly6Cmid-lo cell populations from wild-type (Nr2f6 +/+) or Nr2f6-deficient (Nr2f6 -/-) mice. (C, D) Quantification of blood-derived CD115+ (C), Ly6Chi (C) and Ly6Cmid-lo (D) cell population within CD45+ cells from wild-type (Nr2f6 +/+) or Nr2f6-deficient (Nr2f6 -/-) mice. (E, F) Representative dot plots (E) and quantification (F) of blood-derived CD115-Ly6ChiLy6Ghi neutrophils within CD45+ cells from wild-type (Nr2f6 +/+) or Nr2f6-deficient (Nr2f6 -/-) mice. (G, H) Representative dot plots (G) and quantification (H) of blood-derived Bst2+B220+ pDCs within CD45+ cells from wild-type (Nr2f6 +/+) or Nr2f6-deficient (Nr2f6 -/-) mice. Representative data are shown as pooled experiments of two independent experiments, total n = 6-10/6-10 (Nr2f6+/+ )/(Nr2f6-/- ) per genotype. Each dot represents the data of an individual mouse. Results are shown as median ± IQR with whiskers from min. to max. The Shapiro-Wilk test evaluated the normality of data. Outliers were excluded using ROUT (Q=1%) in GraphPad Prism. Asterisks indicate statistically significant differences between genotypes calculated using the nested t-test (B, C), Student’s t-test, or Mann-Whitney U test for non-parametric data. A p-value < 0.05 was considered statistically significant, **0.01 (See also Supplementary Figure S5 ).
Figure 7
Figure 7
Myeloid compartment in the spleen of Nr2f6-deficient mice. (A) Representative dot plots of splenic CD115+, CD115-, Ly6Chi and Ly6Cmid-lo cell populations from wild-type (Nr2f6 +/+) or Nr2f6-deficient (Nr2f6 -/-) mice. (B-D) Quantification of CD115+ (B), Ly6Chi (C), and Ly6Cmid-lo (D) cells within splenic CD45+ cells of wild-type (Nr2f6 +/+) or Nr2f6-deficient (Nr2f6 -/-) mice. (E, F) Representative dot plots (E) and quantification (F) of splenic CD115-Ly6ChiLy6Ghi cell populations within splenic CD45+ from wild-type (Nr2f6 +/+) or Nr2f6-deficient (Nr2f6 -/-) mice. (G, H) Representative dot plots (G) and quantification (H) of splenic Bst2+B220+ pDC cell populations within splenic CD45+ from wild-type (Nr2f6 +/+) or Nr2f6-deficient (Nr2f6 -/-) mice. Representative data are shown as pooled experiments of two independent experiments, total n = 6/6 (Nr2f6+/+ )/(Nr2f6-/- ). Each dot represents the data of an individual mouse. Results are shown as median ± IQR with whiskers from min. to max. The Shapiro-Wilk test evaluated the normality of data. Outliers were excluded using ROUT (Q=1%) in GraphPad Prism. Asterisks indicate statistically significant differences between genotypes calculated using the Student’s t-test or Mann-Whitney U test for non-parametric data. A p-value < 0.05 was considered statistically significant, **0.01, ****0.0001 (See also Supplementary Figure S5 ).

References

    1. Comazzetto S, Shen B, Morrison SJ. Niches that regulate stem cells and hematopoiesis in adult bone marrow. Dev Cell. (2021) 56:1848–60. doi: 10.1016/j.devcel.2021.05.018 - DOI - PMC - PubMed
    1. Eaves CJ. Hematopoietic stem cells: concepts, definitions, and the new reality. Blood. (2015) 125:2605–13. doi: 10.1182/blood-2014-12-570200 - DOI - PMC - PubMed
    1. Guo B, Huang XX, Lee MR, Lee SA, Broxmeyer HE. Antagonism of PPAR-gamma signaling expands human hematopoietic stem and progenitor cells by enhancing glycolysis. Nat Med. (2018) 24:360–7. doi: 10.1038/nm.4477 - DOI - PMC - PubMed
    1. Morrison SJ, Scadden DT. The bone marrow niche for haematopoietic stem cells. Nature. (2014) 505:327–34. doi: 10.1038/nature12984 - DOI - PMC - PubMed
    1. Pietras EM, Reynaud D, Kang YA, Carlin D, Calero-Nieto FJ, Leavitt AD, et al. . Functionally distinct subsets of lineage-biased multipotent progenitors control blood production in normal and regenerative conditions. Cell Stem Cell. (2015) 17:246–6. doi: 10.1016/j.stem.2015.07.003 - DOI - PMC - PubMed

LinkOut - more resources