. 2025 Jan 7:11:1520050.
doi: 10.3389/fmolb.2024.1520050. eCollection 2024.

Exploring the shared gene signatures and mechanism among three autoimmune diseases by bulk RNA sequencing integrated with single-cell RNA sequencing analysis

Affiliations

Exploring the shared gene signatures and mechanism among three autoimmune diseases by bulk RNA sequencing integrated with single-cell RNA sequencing analysis

Xiaofang Liu et al. Front Mol Biosci. .

Abstract

Background: Emerging evidence underscores the comorbidity mechanisms among autoimmune diseases (AIDs), with innovative technologies such as single-cell RNA sequencing (scRNA-seq) significantly advancing the explorations in this field. This study aimed to investigate the shared genes among three AIDs-Multiple Sclerosis (MS), Systemic Lupus Erythematosus (SLE), and Rheumatoid Arthritis (RA) using bioinformatics databases, and to identify potential biomarkers for early diagnosis.

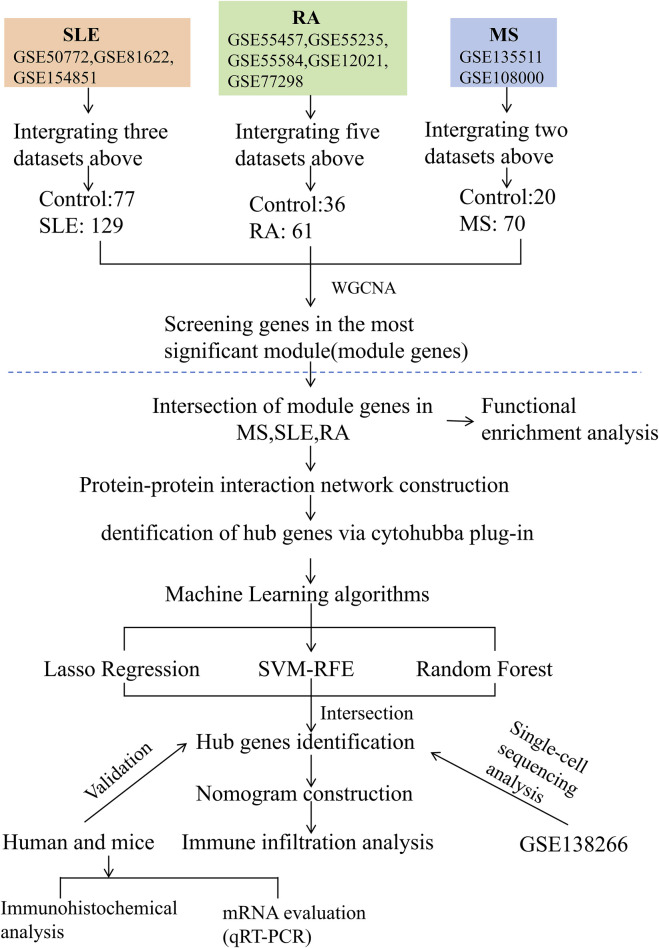
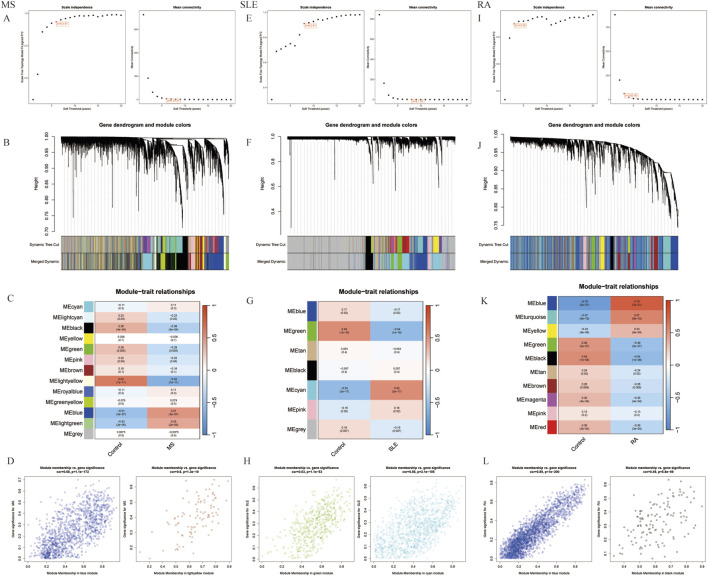
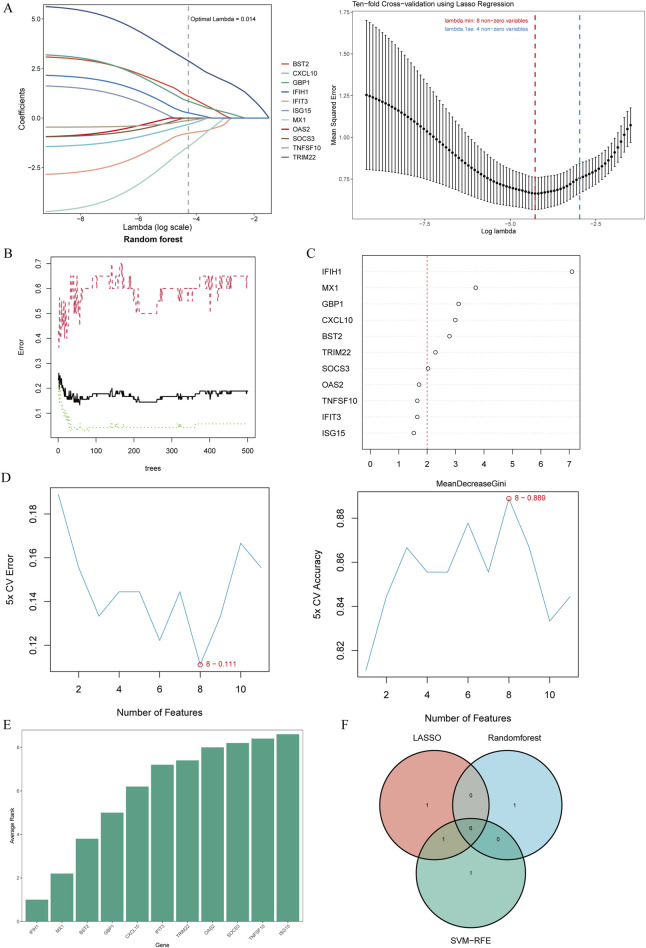
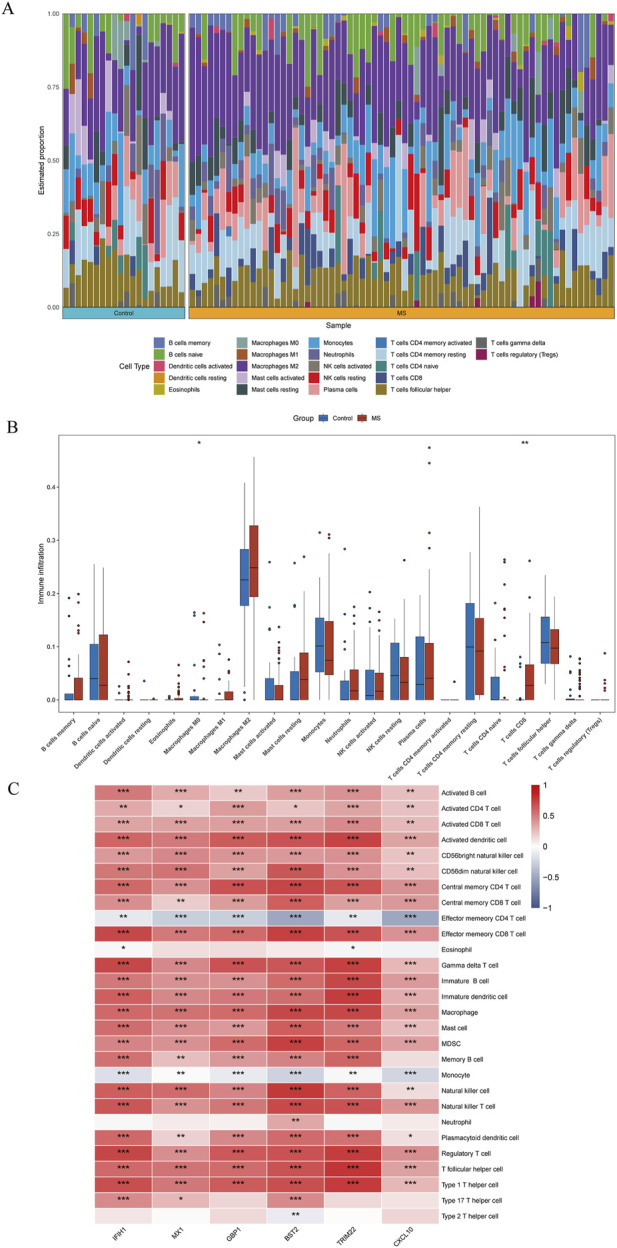
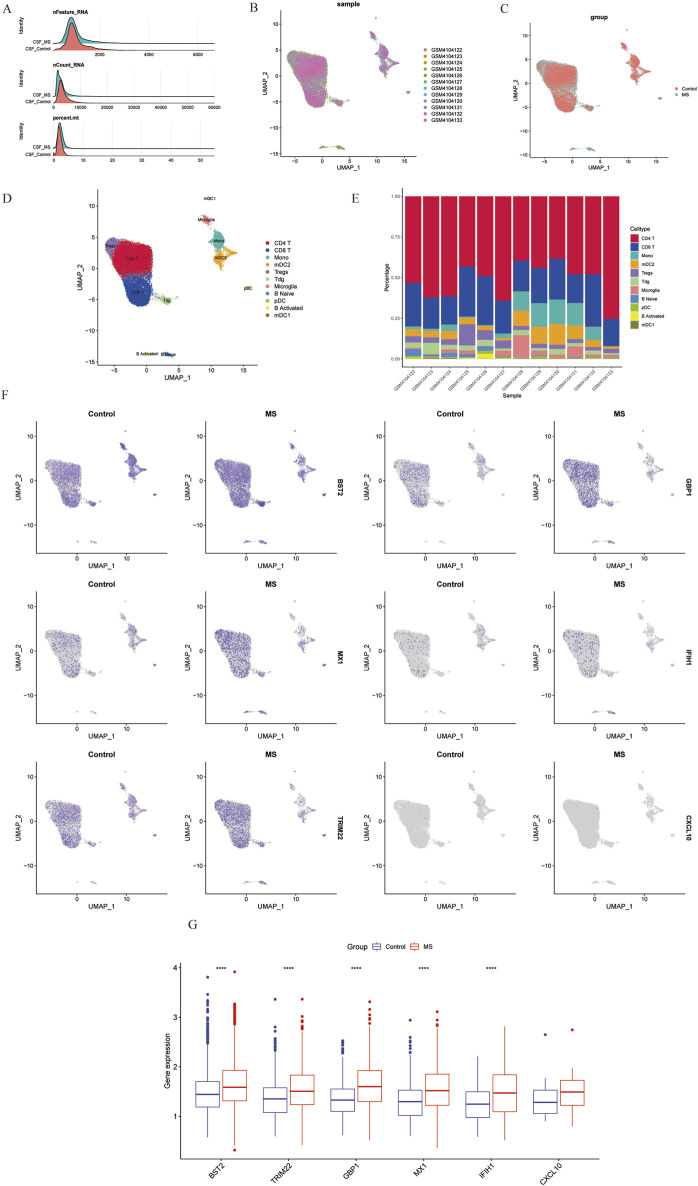
Methods: We retrieved transcriptomic data of MS, SLE, and RA patients from public databases. Weighted Gene Co-Expression Network Analysis (WGCNA) was employed to construct gene co-expression networks and identify disease-associated modules. Functional enrichment analyses and Protein-Protein Interaction (PPI) network was constructed. We used machine learning algorithms to select candidate biomarkers and evaluate their diagnostic value. The Cibersort algorithm was and scRNA-seq analysis was performed to identify key gene expression patterns and assess the infiltration of immune cells in MS patients. Finally, the biomarkers' expression was validated in human and mice experiments.

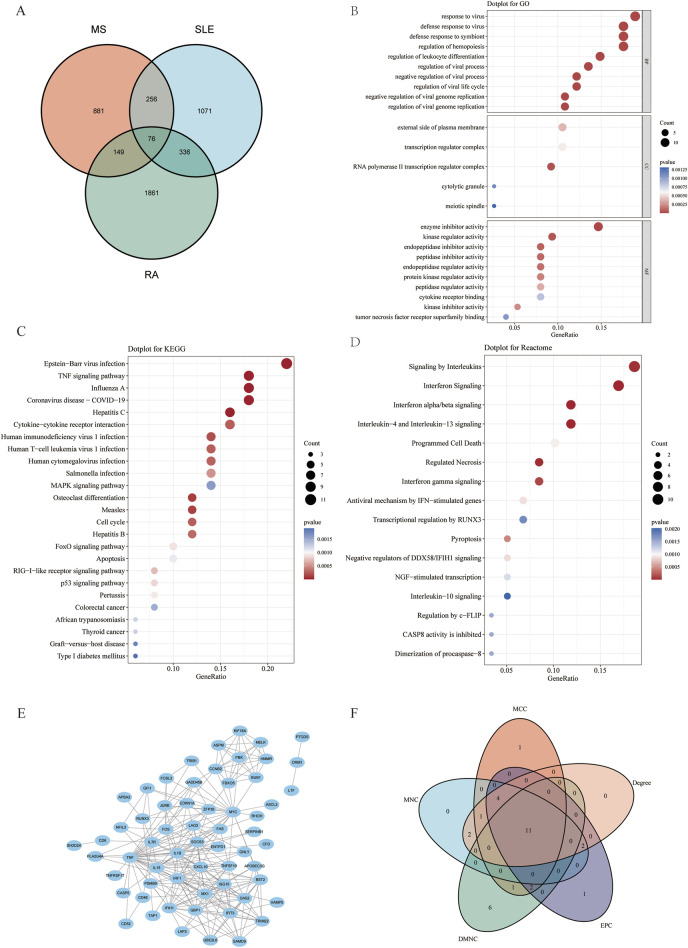
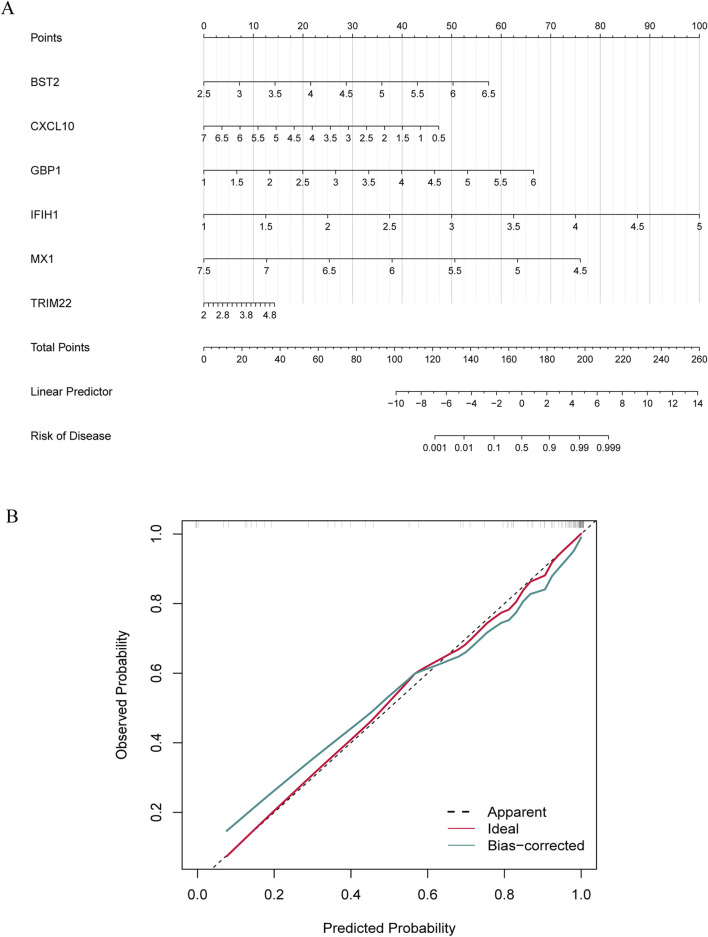
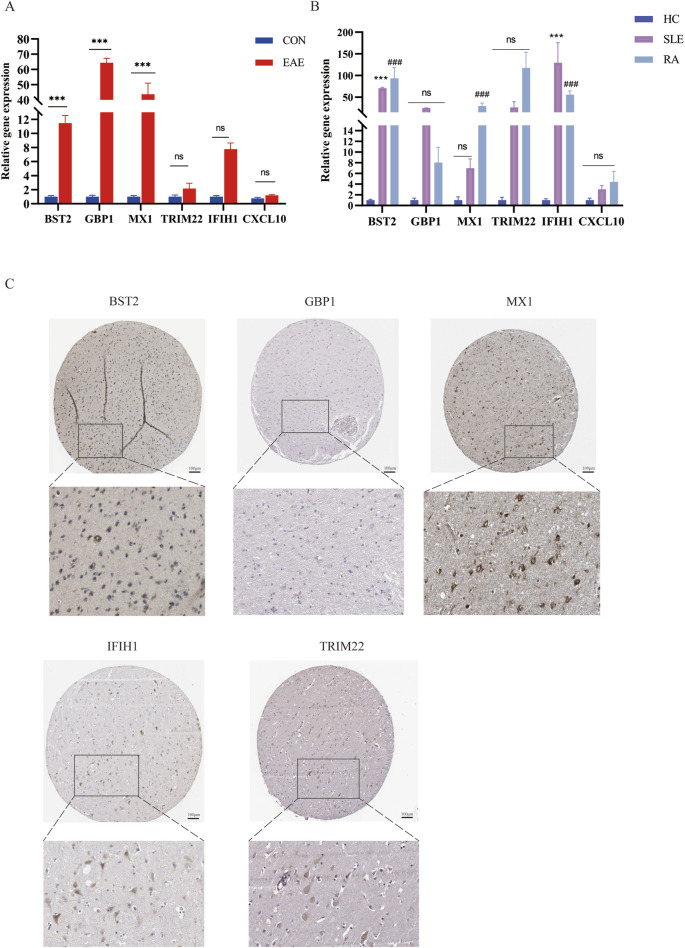
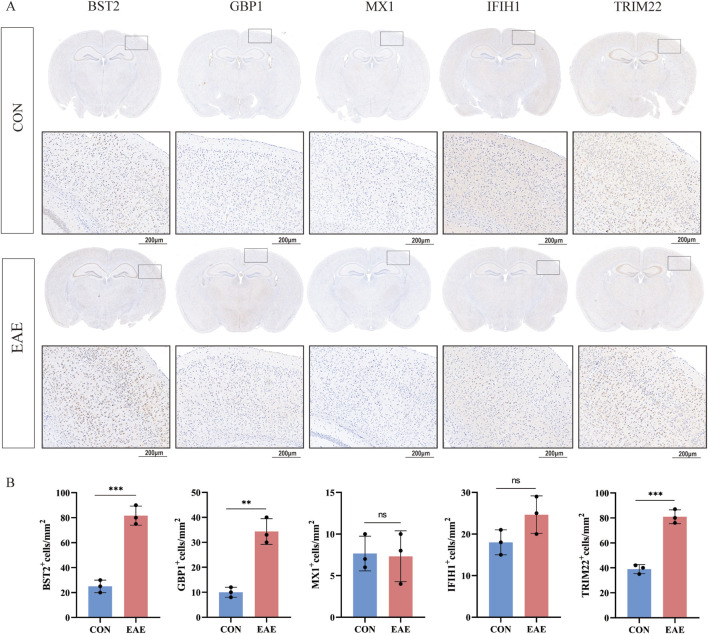
Results: Several shared genes among MS, SLE, and RA were identified, which play crucial roles in immune responses and inflammation regulation. PPI network analysis highlighted key hub genes, some of which were selected as candidate biomarkers through machine learning algorithms. Receiver Operating Characteristic (ROC) curve analysis indicated that some genes had high diagnostic value (Area Under the Curve, AUC >0.7). Immune cell infiltration pattern analysis showed significant differences in the expression of various immune cells in MS patients. scRNA-seq analysis revealed clusters of genes that were significantly upregulated in the single cells of cerebrospinal fluid in MS patients. The expression of shared genes was validated in the EAE mose model. Validation using clinical samples confirmed the expression of potential diagnostic biomarkers.

Conclusion: This study identified shared genes among MS, SLE, and RA and proposed potential early diagnostic biomarkers. These genes are pivotal in regulating immune responses, providing new targets and theoretical basis for the early diagnosis and treatment of autoimmune diseases.

Keywords: DEGs; WGCNA; bioinformatics; multiple sclerosis (MS); rheumatoid arthritis (RA); shared genes; systemic lupus erythematosus (SLE).


Conflict of interest statement

The authors declare that the research was conducted in the absence of any commercial or financial relationships that could be construed as a potential conflict of interest.

Figures

FIGURE 1
FIGURE 1
Flowchart illustrating the study design.
FIGURE 2
FIGURE 2
Selection of gene modules associated with MS with WGCNA. (A) Soft thresholding power (β) selection via scale independence and average connectivity. (B) Gene clusters, or modules, associated with MS are shown in different colors under the cluster dendrogram. (C) The heatmap depicting the correlation between gene modules and MS. The top digit represents the correlation coefficient, and the bottom digit shows the P-value. (D) The scatter plot showing the correlation between module membership and gene significance in MS regarding the most positively (blue) and negatively (light yellow) correlated modules. (E) Identifying the soft-threshold power in SLE. (F) Cluster dendrogram displaying highly connected genes in key modules associated with SLE. (G) Interconnections among modules and traits in SLE. Correlation coefficients and P values are incorporated in each cell. (H) The scatter plot showing the correlation between module membership and gene significance in SLE regarding the most positively (green) and negatively (cyan) correlated modules. (I) Estimation of the soft-threshold power for RA. (J) Dendrogram clustering of RA modules featuring genes with strong connectivity. (K) Associations between modules and traits in RA. (L) The scatter plot showing the correlation between module membership and gene significance in RA regarding the most positively (Blue) and negatively (black) correlated modules. WGCNA, weighted gene co-expression network analysis.
FIGURE 3
FIGURE 3
Functional enrichment analysis of shared genes associated with MS,SLE and RA and the node gene selection from PPI network. (A) The Venn plot displays that the intersection of significant module genes in MS, significant module genes in SLE and significant module genes in RA yielded 76 DEGs. (B–D) GO analysis (BP, CC, MF), KEGG pathway analysis and Reactome analysis of shared genes. The X-axis represents the gene ratio, Y-axis refers to different ontologies, the circle size represents the gene number, and the color indicates the significance. (E) The whole PPI network of 76 DEGs was visualized via STRING. (F) 11 DEGs were selected for further analysis based on the intersection of genes from five algorithms. GO, gene ontology; KEGG, Kyoto Encyclopedia of Genes and Genomes. PPI, Protein-protein interaction.
FIGURE 4
FIGURE 4
Candidate biomarker identification via machine learning algorithms. (A) Based on the Lasso regression algorithm, 8 genes were identified as the biomarkers with the lowest binominal deviation. (B) The diagnostic error relating to MS,SLE and RA was visualized from the random forest. (C) The column showing 11 DEGs ranked based on the importance score calculated from the random forest. (D) 11 genes were selected based on SVM-RFE with the lowest error and highest accuracy. (E) DEGs were ordered based on the average rank from SVM-RFE. The lower rank indicates positions of higher importance. (F) The intersection of 3 machine learning algorithms was obtained with a Venn diagram tool, yielding 6 DEGs selected as the candidate biomarkers. LASSO, least absolute shrinkage and selection operator; SVM-RFE, support vector machine recursive feature elimination; AMI, acute myocardial infarction.
FIGURE 5
FIGURE 5
Nomogram construction and diagnostic performance validation. (A) The nomogram was established based on the 6 selected candidate biomarkers. Each gene corresponds to a score. The total score of the 6 DEGs is used to predict the risk of MS in a population with MS and RA. (B) The calibration curve of nomogram model prediction in MS with SLE and RA. The red solid line is marked as “Ideal”, which represents the standard curve, and is on behalf of the perfect prediction of the ideal model. The dotted line is marked as “Apparent”, which indicates the uncalibrated prediction curve, while the blue solid line is marked as “Bias-corrected” and represents the calibrated prediction curve.
FIGURE 6
FIGURE 6
Quantification of immune cell infiltration in MS. (A) The relative proportion of 22 types of immune infiltrating cells in MS samples is shown as a barplot. (B) The boxplot compares the expression of immune cells between MS and controls. (C) Correlation analysis of immune cell infiltrations with six shared genes. *p < 0.05; **p < 0.01; ***p < 0.001; ****p < 0.0001.
FIGURE 7
FIGURE 7
Overview of single-cell atlases of normal and MS samples. (A) Quality control of scRNA-seq data of samples of HCC cells. (B) UMAP visualization of clustering plot of 10 samples. (C) UMAP visualization of clustering plot comparing control and MS tissues. (D) UMAP visualization of plot depicting clustering of single-cell samples into 11 clusters. (E) Proportional representation of different cell types in 10 sampes. (F) UMAP plot highlighting the expression patterns of marker genes for the 11 cell types. (G) Boxplots displaying expression of marker genes for the 8 cell types across cells. UMAP, Uniform Manifold Approximation and Projection.
FIGURE 8
FIGURE 8
The mRNA expression of six shared genes in human and mice. (A) qRT-PCR showing increased mRNA levels of BST2, GBP1, MX1, IFIH1, TRIM22, and CXCL10 in the spinal cord of EAE mice. (B) The expression of six hub genes in SLE and RA patients. qRT-PCR showing increased mRNA levels of BST2, GBP1, MX1, IFIH1, TRIM22 and CXCL10 in PBMC of SLE and RA patients. (C) IHC results in the expression of the five key genes for normal people cortex in the HPA database. HPA, Human Protein Atlas.
FIGURE 9
FIGURE 9
The expression of five shared genes in EAE mice brain. (A) Representative IHC staining images of BST2, GBP1, MX1, IFIH1, and TRIM22 in control and EAE mice. (B) Comparison of protein expression differences of five hub genes according to IHC results. **p < 0.01, ***p < 0.001.

References

    1. Ahmad R., Ahsan H. (2022). Dual autoimmune diseases: rheumatoid arthritis with systemic lupus erythematosus and Type 1 diabetes mellitus with multiple sclerosis. Rheumatology and Autoimmun. 2, 120–128. 10.1002/rai2.12037 - DOI
    1. Arnett F. C., Edworthy S. M., Bloch D. A., McShane D. J., Fries J. F., Cooper N. S., et al. (1988). The American Rheumatism Association 1987 revised criteria for the classification of rheumatoid arthritis. Arthritis Rheum. 31, 315–324. 10.1002/art.1780310302 - DOI - PubMed
    1. Assan F., Seror R., Mariette X., Nocturne G. (2021). New 2019 SLE EULAR/ACR classification criteria are valuable for distinguishing patients with SLE from patients with pSS. Ann. Rheum. Dis. 80, e122. 10.1136/annrheumdis-2019-216222 - DOI - PubMed
    1. Attfield K. E., Jensen L. T., Kaufmann M., Friese M. A., Fugger L. (2022). The immunology of multiple sclerosis. Nat. Rev. Immunol. 22, 734–750. 10.1038/s41577-022-00718-z - DOI - PubMed
    1. Barrett T., Wilhite S. E., Ledoux P., Evangelista C., Kim I. F., Tomashevsky M., et al. (2013). NCBI GEO: archive for functional genomics data sets--update. Nucleic Acids Res. 41, D991–D995. 10.1093/nar/gks1193 - DOI - PMC - PubMed

LinkOut - more resources