. 2025 Jan 7:15:1520158.
doi: 10.3389/fphar.2024.1520158. eCollection 2024.

Therapeutic effects of composite probiotics derived from fermented camel milk on metabolic dysregulation and intestinal barrier integrity in type 2 diabetes rats

Affiliations

Therapeutic effects of composite probiotics derived from fermented camel milk on metabolic dysregulation and intestinal barrier integrity in type 2 diabetes rats

Tabusi Manaer et al. Front Pharmacol. .

Abstract

Background: In the Kazakh community of Xinjiang, China, fermented camel milk has been traditionally used to manage diabetes. This study evaluates the effects of composite probiotics derived from fermented camel milk (CPCM) on metabolic disturbances in a rat model of Type 2 diabetes (T2DM).

Methods: T2DM was induced in Wistar rats using streptozotocin. Experimental groups included a diabetic control, Metformin, and low- and high-dose CPCM. Measurements over 6 weeks included body weight (BW), fasting blood glucose (FBG), oral glucose tolerance test (OGTT), glycated hemoglobin (HbA1c), C-peptide (CP), lipid profiles, inflammatory markers, fecal short-chain fatty acids (SCFAs), and tight junction protein expression in colonic tissues.

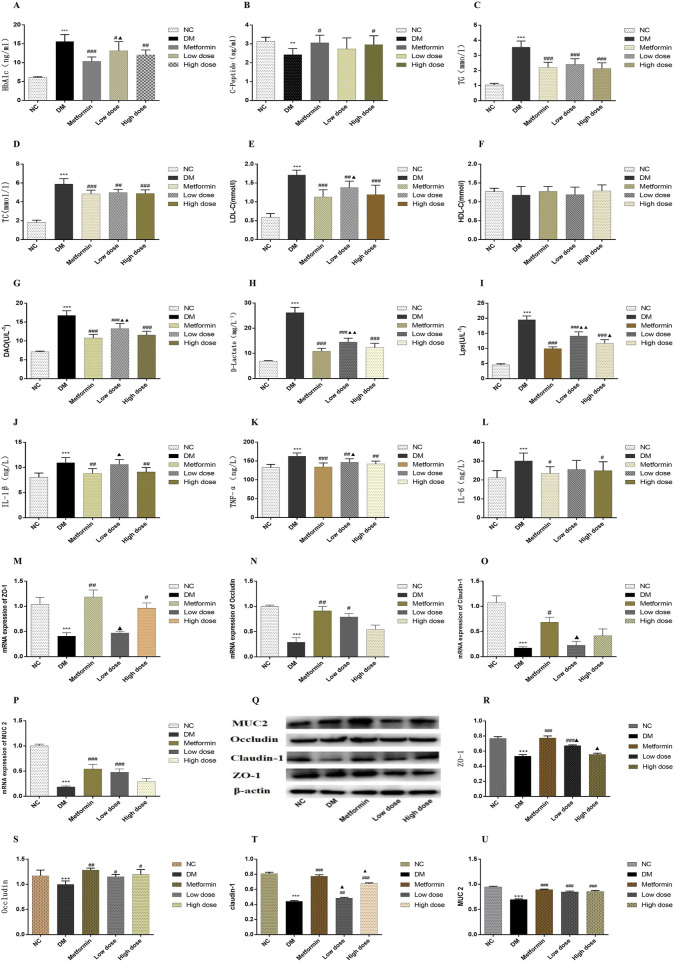
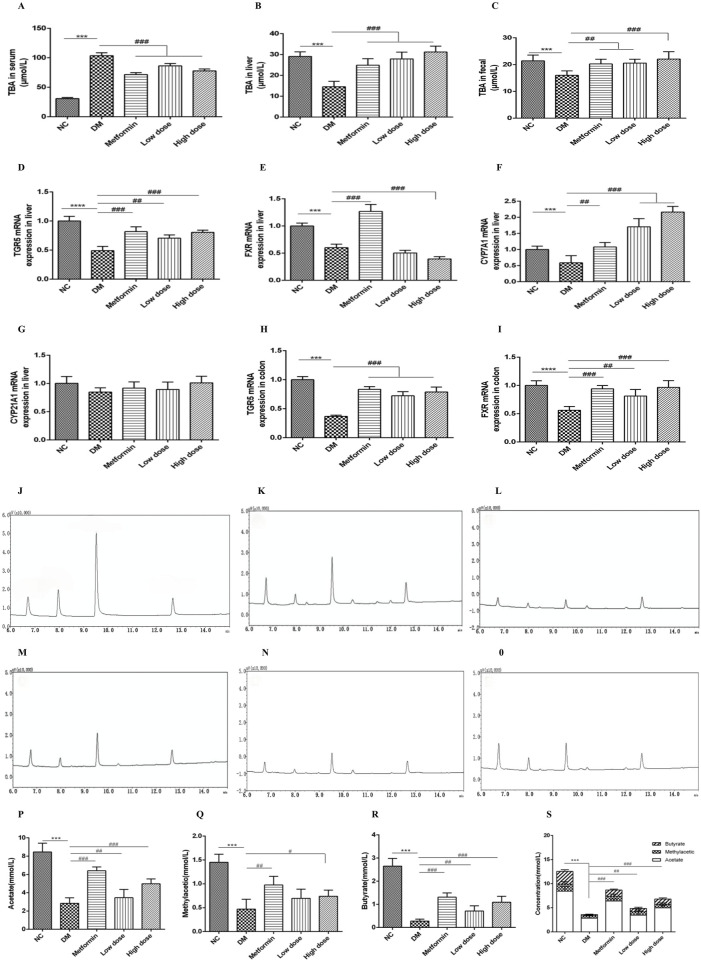
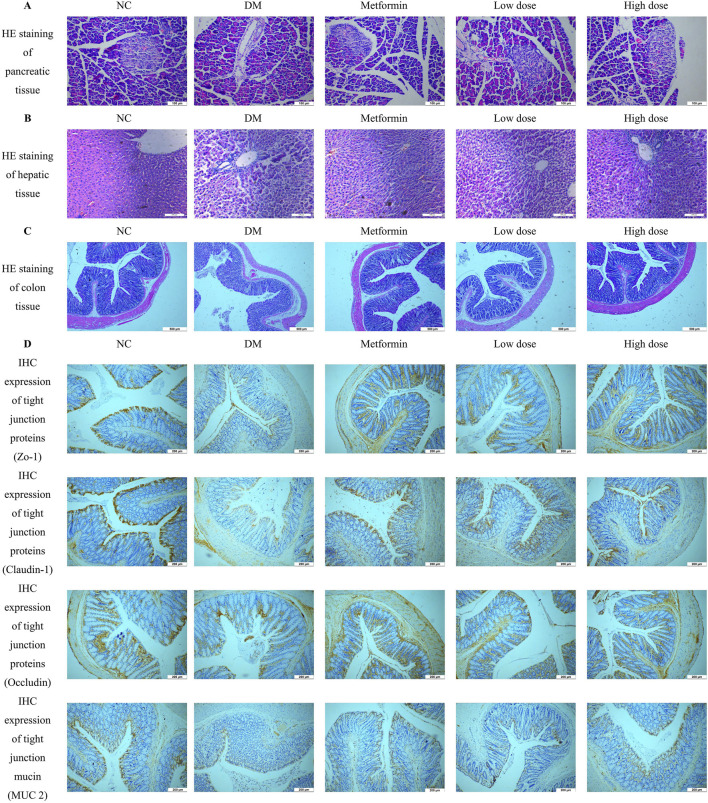
Results: High-dose CPCM significantly increased BW by 22.2% (p < 0.05) and reduced FBG by 6.5 mmol/L (p < 0.001). The OGTT AUC decreased by 40.1% (p < 0.001), and HbA1c levels fell by 22.9% (p < 0.01). CP levels rose by 21.8% (p < 0.05). Lipid profiles improved: TC decreased by 40.0%, TG by 17.1%, and LDL-C by 30.4% (all p < 0.001). Fecal SCFAs, including acetate (75.4%, p < 0.001), methyl acetate (18.9%, p < 0.05), and butyrate (289.9%, p < 0.001), increased, with total SCFAs rising by 89.7% (p < 0.001). Inflammatory markers IL-1β (12.7%, p < 0.01), TNF-α (16.7%, p < 0.05), and IL-6 (17.3%, p < 0.01) were significantly reduced. Tight junction protein expression (ZO-1, occludin, claudin-1) and mucin (MUC2) in colonic tissues increased (p < 0.05). CPCM treatment also reduced serum total bile acids by 24.9%, while hepatic and fecal bile acids increased by 114.0% and 37.8% (all p < 0.001). CPCM lowered serum DAO, D-lactate, and LPS levels (all p < 0.001). mRNA levels of TGR5 and CYP7A1 in the liver, and TGR5 and FXR in the colon, were markedly elevated (all p < 0.001). Histological examinations revealed reduced pancreatic inflammation and hepatic steatosis, with restored colonic structure.

Conclusion: CPCM treatment significantly improved metabolic dysregulation in the T2DM rat model, reducing blood glucose and lipid levels, enhancing intestinal barrier function, and increasing insulin secretion. These findings highlight the therapeutic potential of CPCM in T2DM management and probiotics' role in metabolic health.

Keywords: colon health; composite probiotics; fermented camel milk; lactic acid bacteria; tight junction proteins; type 2 diabetes; yeast.


Conflict of interest statement

The authors declare that the research was conducted in the absence of any commercial or financial relationships that could be construed as a potential conflict of interest.

Figures

FIGURE 1
FIGURE 1
Impact of CPCM on Biomarker Levels and Protein Expression in Colon Tissues. This figure presents the effects of CPCM on serum levels of various biomarkers, including (A) HbA1c, (B) CP, (C) TC, (D) TG, (E) LDL-C, (F) HDL-C, (G) DAO, (H) D-lactate, (I) LPS, (J) IL-1β, (K) TNF-α, and (L) IL-6. Additionally, the mRNA expression levels of tight junction proteins, including (M) ZO-1, (N) Occludin, and (O) Claudin-1, as well as mucin (P) MUC2, were assessed. Furthermore, (Q) Western blot analyses were conducted to evaluate the protein expression levels of tight junction proteins [(R) ZO-1, (S) Occludin, (T) Claudin-1] and mucin [(U) MUC2] in colon tissues. The study included a sample size of 8 rats, with results expressed as mean ± standard deviation (SD). **p < 0.01, ***p < 0.001 vs. NC; # p < 0.05, ## p < 0.01, ### p < 0.001 vs. DM; p < 0.01, ▲▲ p < 0.001 vs. Metformin. These statistical comparisons indicate significant differences between the groups in the study.
FIGURE 2
FIGURE 2
Impact of CPCM on bile acid metabolism and the expression of critical regulatory genes associated with bile acid homeostasis, along with gas chromatograms of short-chain fatty acids (SCFAs) from fecal samples, highlighting the concentrations of acetate, methyl acetate, butyrate, and total SCFAs in T2DM rats. (A–C) demonstrate the influence of CPCM on serum, hepatic, and fecal bile acid levels, respectively, in T2DM rats. Furthermore, (D–G) illustrate the effect of CPCM on hepatic mRNA expression of TGR5, FXR, CYP7A1, and CYP21A1 in the same cohort. (H, I) present the impact of CPCM on colonic mRNA expression of TGR5 and FXR, respectively. Gas chromatograms representing SCFAs from fecal samples in T2DM rats are shown, with (J) displaying the chromatogram of the standard sample. (K–O) depict gas chromatograms for the NC group, DM group, Metformin group, Low dose group, and High dose group, respectively. (P–S) illustrate the concentrations of acetate, methyl acetate, butyrate, and total SCFAs in fecal samples across different groups of T2DM rats. The study included a sample size of 8 rats, with results expressed as mean ± standard deviation (SD). ***p < 0.001 vs. NC; # p < 0.05, ## p < 0.01, ### p < 0.001 vs. DM. These statistical comparisons indicate significant differences between the groups in the study.
FIGURE 3
FIGURE 3
Impact of CPCM on Histological and Immunohistochemical Analysis of Pancreatic and Colon Tissue Architecture. (A) shows Hematoxylin and Eosin (HE) staining of pancreatic tissue architecture, with images captured at a magnification of ×200. The scale bar represents 100 µm. (B) presents HE staining of hepatic tissue architecture, also captured at a magnification of ×200, with a scale bar indicating 100 µm. (C) illustrates HE staining of colon tissue architecture, with images taken at a magnification of ×100 and a scale bar representing 500 µm. (D) displays the Immunohistochemistry (IHC) expression of tight junction proteins (ZO-1, Claudin-1, Occludin) and mucin (MUC2) in the colon of rats. Images were captured at a magnification of ×40, with a scale bar representing 200 µm. The analysis included a sample size of 8 rats per group.

Similar articles

Cited by

References

    1. Adams M. T., Blum B. (2022). Determinants and dynamics of pancreatic islet architecture. Islets 14 (1), 82–100. 10.1080/19382014.2022.2030649 - DOI - PMC - PubMed
    1. Adler A. I., Coleman R. L., Leal J., Whiteley W. N., Clarke P., Holman R. R. (2024). Post-trial monitoring of a randomised controlled trial of intensive glycaemic control in type 2 diabetes extended from 10 years to 24 years (UKPDS 91). Lancet 404, 145–155. 10.1016/S0140-6736(24)00537-3 - DOI - PubMed
    1. Akash M. S. H., Rehman K., Liaqat A. (2018). Tumor necrosis factor-alpha: role in development of insulin resistance and pathogenesis of type 2 diabetes mellitus. J. Cell Biochem. 119 (1), 105–110. 10.1002/jcb.26174 - DOI - PubMed
    1. Bilal Z., Akhmetsadykova S., Baubekova A., Tormo H., Faye B., Konuspayeva G. (2024a). The main features and microbiota diversity of fermented camel milk. Foods 13 (13), 1985. 10.3390/foods13131985 - DOI - PMC - PubMed
    1. Bilal Z., Kondybayev A., Ospanova A., Tormo H., Akhmetsadykova S., Amutova F., et al. (2024b). Volatile organic compounds of camel milk and shubat across Kazakhstan's regions, seasons, and breeds. Heliyon 10 (15), e35365. 10.1016/j.heliyon.2024.e35365 - DOI - PMC - PubMed

LinkOut - more resources