

Correlation between the white blood cell/platelet ratio and 28-day all-cause mortality in cardiac arrest patients: a retrospective cohort study based on machine learning
- PMID: 39840106
- PMCID: PMC11746087
- DOI: 10.3389/fphar.2024.1527664
Correlation between the white blood cell/platelet ratio and 28-day all-cause mortality in cardiac arrest patients: a retrospective cohort study based on machine learning
Abstract
Objective: This study aims to evaluate the association between the white blood cell-to-platelet ratio (WPR) and 28-day all-cause mortality among patients experiencing cardiac arrest.
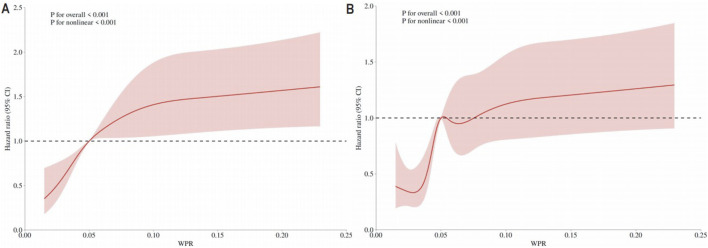
Methods: Utilizing data from 748 cardiac arrest patients in the Medical Information Mart for Intensive Care-IV (MIMIC-IV) 2.2 database, machine learning algorithms, including the Boruta feature selection method, random forest modeling, and SHAP value analysis, were applied to identify significant prognostic biomarkers. Key patient characteristics, encompassing demographic data, comorbidities, hematological and biochemical indices, and vital signs, were extracted using PostgreSQL Administration Tool (pgAdmin) software. The Cox proportional hazards model assessed the impact of WPR on mortality outcomes, while Kaplan-Meier survival curves and restricted cubic spline (RCS) analysis further validated the findings. Subgroup analyses stratified the prognostic value of WPR by demographic and clinical factors.
Results: WPR demonstrated the highest prognostic significance among the variables studied, showing a strong association with 28-day all-cause mortality. In the unadjusted Model 1, hazard ratios (HRs) for WPR quartiles ranged from 1.88 (95% CI: 1.22-2.90) in Q2 to 3.02 (95% CI: 2.04-4.47) in Q4 (Ptrend <0.05). Adjusted models (Models 2-4) confirmed the robustness of these associations, even after accounting for demographic and clinical covariates. Kaplan-Meier and RCS analyses revealed a significant U-shaped relationship between WPR and mortality risk. Subgroup analyses indicated that elevated WPR was particularly associated with increased mortality in males, elderly patients, married individuals, and those with chronic pulmonary disease.
Conclusion: WPR serves as an independent and reliable prognostic biomarker for 28-day mortality in cardiac arrest patients. Its integration into clinical decision-making may enhance the early identification of high-risk patients and guide tailored therapeutic interventions.
Keywords: 8-day all-cause mortality; cardiac arrest (CA); cardiopulmonary resuscitation (CPR); prognosis; white blood cell to platelet ratio (WPR).
Copyright © 2025 Huang, Ren, Sun, Li, Zheng, Dong, Zhu, Zhu and Jiang.
Conflict of interest statement
The authors declare that the research was conducted in the absence of any commercial or financial relationships that could be construed as a potential conflict of interest.
Figures


Similar articles
-
Predicting 28-day all-cause mortality in patients admitted to intensive care units with pre-existing chronic heart failure using the stress hyperglycemia ratio: a machine learning-driven retrospective cohort analysis.Cardiovasc Diabetol. 2025 Jan 8;24(1):10. doi: 10.1186/s12933-025-02577-z. Cardiovasc Diabetol. 2025. PMID: 39780223 Free PMC article.
-
Relationship between initial red cell distribution width and ΔRDW and mortality in cardiac arrest patients.ESC Heart Fail. 2024 Feb;11(1):433-443. doi: 10.1002/ehf2.14602. Epub 2023 Nov 29. ESC Heart Fail. 2024. PMID: 38030411 Free PMC article.
-
Association between red blood cell distribution width-to-albumin ratio and prognosis in post-cardiac arrest patients: data from the MIMIC-IV database.Front Cardiovasc Med. 2025 Jan 7;11:1499324. doi: 10.3389/fcvm.2024.1499324. eCollection 2024. Front Cardiovasc Med. 2025. PMID: 39839831 Free PMC article.
-
Association between stress hyperglycemia ratio index and all-cause mortality in critically ill patients with atrial fibrillation: a retrospective study using the MIMIC-IV database.Cardiovasc Diabetol. 2024 Oct 14;23(1):363. doi: 10.1186/s12933-024-02462-1. Cardiovasc Diabetol. 2024. PMID: 39402588 Free PMC article.
-
Association of serum chloride levels with all-cause mortality among patients in surgical intensive care units: a retrospective analysis of the MIMIC-IV database.BMC Anesthesiol. 2025 Jan 3;25(1):3. doi: 10.1186/s12871-024-02870-6. BMC Anesthesiol. 2025. PMID: 39754073 Free PMC article.
References
-
- Adrie C., Adib-Conquy M., Laurent I., Monchi M., Vinsonneau C., Fitting C., et al. (2002). Successful cardiopulmonary resuscitation after cardiac arrest as a “sepsis-like” syndrome. Circulation 106 (5), 562–568. 10.1161/01.cir.0000023891.80661.ad - DOI - PubMed
-
- Chattopadhyay S. (2024). Decoding medical diagnosis with machine learning classifiers. Medinformatics. 10.47852/bonviewMEDIN42022583 - DOI
LinkOut - more resources
Full Text Sources