. 2025 Jan 14;14(1):59-73.
doi: 10.1515/nanoph-2024-0469. eCollection 2025 Jan.

Photon antibunching in single-molecule vibrational sum-frequency generation

Affiliations

Photon antibunching in single-molecule vibrational sum-frequency generation

Fatemeh Moradi Kalarde et al. Nanophotonics. .

Abstract

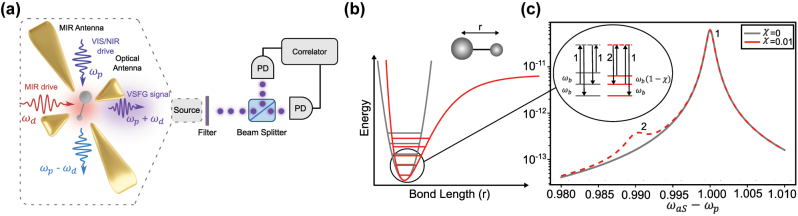
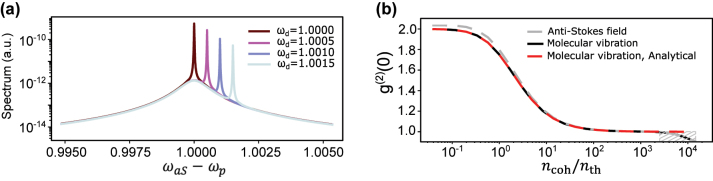
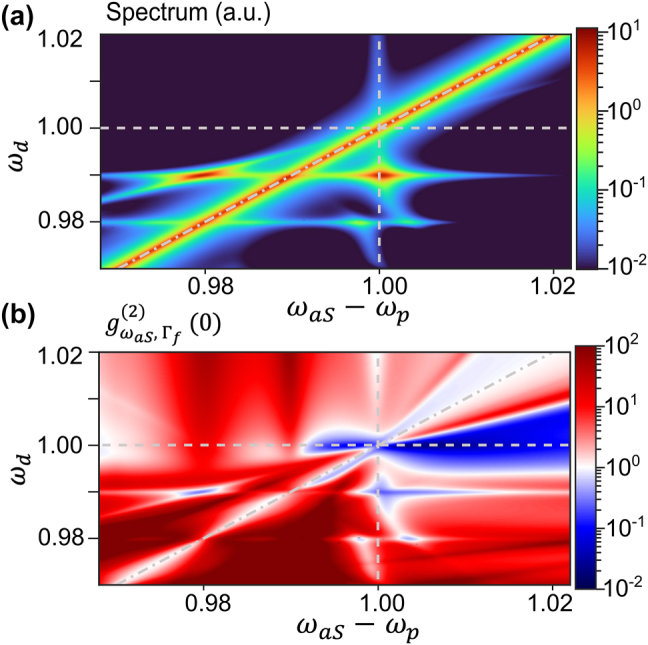
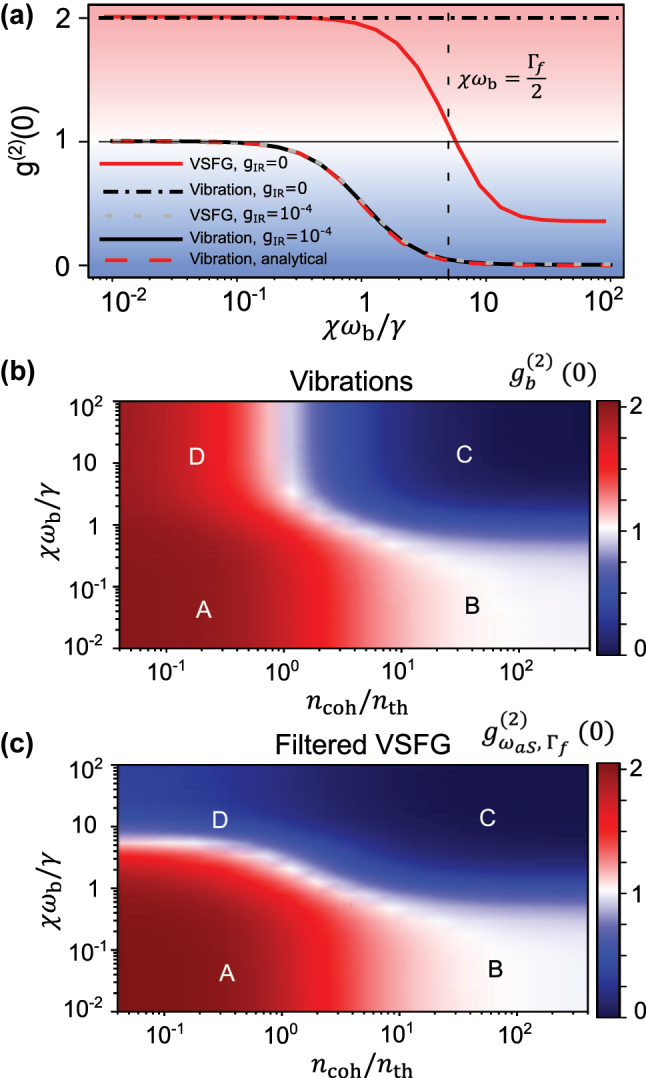
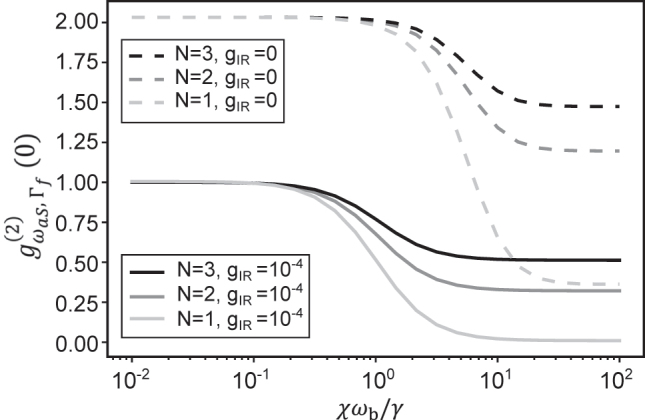
Sum-frequency generation (SFG) enables the coherent upconversion of electromagnetic signals and plays a significant role in mid-infrared vibrational spectroscopy for molecular analysis. Recent research indicates that plasmonic nanocavities, which confine light to extremely small volumes, can facilitate the detection of vibrational SFG signals from individual molecules by leveraging surface-enhanced Raman scattering combined with mid-infrared laser excitation. In this article, we compute the degree of second order coherence (g (2)(0)) of the upconverted mid-infrared field under realistic parameters and accounting for the anharmonic potential that characterizes vibrational modes of individual molecules. On the one hand, we delineate the regime in which the device should operate in order to preserve the second-order coherence of the mid-infrared source, as required in quantum applications. On the other hand, we show that an anharmonic molecular potential can lead to antibunching of the upconverted photons under coherent, Poisson-distributed mid-infrared and visible drives. Our results therefore open a path toward bright and tunable source of indistinguishable single photons by leveraging "vibrational blockade" in a resonantly and parametrically driven molecule, without the need for strong light-matter coupling.

Keywords: cavity optomechanics; nanocavities; photon blockade; photonics; single photon source; vibrational spectroscopy.


Conflict of interest statement

Conflict of interest: Authors state no conflicts of interest.

Figures

Figure 1:
Figure 1:
Overview of the proposed scheme. (a) VIS and MIR antennas mediate an efficient interaction between photonic and molecular vibrational modes [20]. A spectrometer or HBT interferometer measures the intensity spectrum or the frequency-filtered second-order correlation of the scattered photons, respectively. (b) Vibrational potential of the molecule considering either a Morse potential (red line) or its harmonic approximation (grey line). (c) As a result of anharmonicity, a second peak (labelled 2) emerges in the thermally activated spontaneous anti-Stokes Raman spectrum, corresponding to the Raman transition from the second to the first excited vibrational levels (see inset). The energy difference between transitions 1 and 2 is noted χω b, whereby χ quantifies the strength of anharmonicity in units of the Raman shift ω b . The thermal occupancy is set here to n th = 5 × 10⁻³.
Figure 2:
Figure 2:
VSFG under harmonic vibrational potential. (a) Anti-Stokes spectra at various mid-infrared laser frequencies. The sharp peak, with its frequency shifting in accordance with the MIR laser frequency, exhibits a linewidth that corresponds to the filter’s characteristics. (b) Second-order correlation function of anti-Stokes photons, gωaS,Γf(2)(0) , and molecular vibrations, gb(2)(0) , computed both numerically and analytically, plotted versus the ratio of coherent population over thermal population. The coherent population is defined in Eq. (11) and relates to MIR drive strength quadratically. No anharmonicity is assumed (χ = 0). Dashed area shows the interval where the truncated Hilbert space fails to correctly approximate the infinite number of levels of a harmonic oscillator.
Figure 3:
Figure 3:
VSFG under anharmonic vibrational potential. Maps of the (a) emission intensity and (b) second-order correlation function of the filtered anti-Stokes field as a function of the MIR driving frequency ω d and VIS/NIR emission Raman shift ω aSω p, under strong MIR driving (g IR = 10−4 or equivalently n coh = 0.04 for ω d = 1). The dot-dashed grey lines indicate ω d = ω aSω p.
Figure 4:
Figure 4:
Regimes of statistics of VSFG (a) evolution of frequency-blind second-order correlation function of the vibrational mode, gb(2)(0) , and of the frequency-filtered second-order correlation function of the anti-Stokes field, gωaS,Γf(2)(0) , plotted against the relative strength of anharmonicity, both in the absence (g IR = 0) and in the presence (g IR = 10−4 or equivalently n coh = 0.04) of MIR drive. The analytical curve is from Eq. (14). (b,c) Second-order correlation function of vibrations, gb(2)(0) , in (b) and filtered anti-Stokes field, gωaS,Γf(2)(0) , in (c) plotted versus the dimensionless strengths of MIR drive and anharmonicity. Capital letters identify four regions of parameters discussed in the text.
Figure 5:
Figure 5:
Frequency-filtered second-order correlation function of the anti-Stokes field, gωaS,Γf(2)(0) , plotted versus anharmonicity for different number of molecules.
Figure 6:
Figure 6:
Beam splitter with transmission and reflection coefficients of t and r and two input arms and two output arms.
Figure 7:
Figure 7:
Variation of the second-order correlation function of the filtered anti-Stokes field gωaS,Γf(2)(0) versus the strength of anharmonicity in the high MIR drive strength regime (g IR = 10−4 or n coh = 0.04), considering different filter linewidths Γf. We recall that γ = 10−3.
Figure 8:
Figure 8:
Variation of the second-order correlation function of the filtered anti-Stokes field gωaS,Γf(2)(0) versus the strength of anharmonicity in the absence of MIR drive (g IR = 0), considering different filter linewidths Γf. We recall that γ = 10−3.
Figure 9:
Figure 9:
Value of the anharmonicity parameter χ computed by DFT for thiophenol (TP, blue triangle) and gold-bound thiophenol (GTP, orange triangle) plotted against the normal mode frequency.

Similar articles

References

    1. Eisaman M. D., Fan J., Migdall A., Polyakov S. V. Invited review article: Single-photon sources and detectors. Rev. Sci. Instrum. . 2011;82(7):071101. doi: 10.1063/1.3610677. - DOI - PubMed
    1. Knill E., Laflamme R., Milburn G. J. A scheme for efficient quantum computation with linear optics. Nature . 2001;409(6816):46–52. doi: 10.1038/35051009. - DOI - PubMed
    1. Greentree A. D., Hollenberg L. C. L. High-performance diamond-based single-photon sources for quantum communication. Phys. Rev. A . 2009;80(5):052308. doi: 10.1103/physreva.80.052308. - DOI
    1. Müller M., et al. Quantum-dot single-photon sources for entanglement enhanced interferometry. Phys. Rev. Lett. . 2017;118(25):257402. doi: 10.1103/physrevlett.118.257402. - DOI - PubMed
    1. Santori C., Fattal D., Vučković J., Solomon G. S., Yamamoto Y. Indistinguishable photons from a single-photon device. nature . 2002;419(6907):594–597. doi: 10.1038/nature01086. - DOI - PubMed

LinkOut - more resources