. 2025 Feb 14;136(4):379-399.
doi: 10.1161/CIRCRESAHA.124.325374. Epub 2025 Jan 22.

Mineral Stress Drives Loss of Heterochromatin: An Early Harbinger of Vascular Inflammaging and Calcification

Affiliations

Mineral Stress Drives Loss of Heterochromatin: An Early Harbinger of Vascular Inflammaging and Calcification

Chin Yee Ho et al. Circ Res. .

Abstract

Background: Vascular calcification is a detrimental aging pathology markedly accelerated in patients with chronic kidney disease. PLA (prelamin A) is a biomarker of vascular smooth muscle cell aging that accelerates calcification however the mechanisms remain undefined.

Methods: Vascular smooth muscle cells were transduced with PLA using an adenoviral vector and epigenetic modifications were monitored using immunofluorescence and targeted polymerase chain reaction array. Epigenetic findings were verified in vivo using immunohistochemistry in human vessels, in a mouse model of inducible prelamin A expression, and in a rat model of chronic kidney disease-induced calcification. Transcriptomic and chromatin immunoprecipitation followed by sequencing analyses were used to identify gene targets impacted by changes in the epigenetic landscape. Molecular tools and antibody arrays were used to monitor the effects of mineral dysregulation on heterochromatin, inflammation, aging, and calcification.

Results: Here, we report that depletion of the repressive heterochromatin marks, H3K9me3 (histone H3, lysine 9, trimethylation) and H3K27me3 (histone H3, lysine 27,trimethylation), is an early hallmark of vascular aging induced by both nuclear lamina dysfunction and dysregulated mineral metabolism, which act to modulate the expression of key epigenetic writers and erasers. Global analysis of H3K9me3 and H3K27me3 marks and pathway analysis revealed deregulation of insulin signaling and autophagy pathways as well as cross-talking DNA damage and NF-κB (nuclear factor κB) inflammatory pathways consistent with early activation of the senescence-associated secretory phenotype. Expression of PLA in vivo induced loss of heterochromatin and promoted inflammation and osteogenic differentiation which preceded aging indices, such as DNA damage and senescence. Vessels from children on dialysis and rats with chronic kidney disease showed prelamin A accumulation and accelerated loss of heterochromatin before the onset of calcification.

Conclusions: Dysregulated mineral metabolism drives changes in the epigenetic landscape and nuclear lamina dysfunction that together promote early induction of inflammaging pathways priming the vasculature for downstream pathological change.

Keywords: aging; heterochromatin; lamins; muscle, smooth, vascular.


Conflict of interest statement

None.

Figures
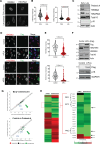
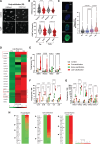
Figure 1.
Figure 1.
PLA (prelamin A) accumulation in vascular smooth muscle cells (VSMCs) results in reduction in heterochromatin marks H3K9me3 (histone H3, lysine 9, trimethylation) and H3K27me3 (histone H3, lysine 27, trimethylation) and epigenetic reprogramming. A, Representative immunofluorescence images of young (passage 4) and senescent (passage 25) VSMCs labeled with anti-H3K9me3 or anti-H3K27me3 antibodies. Scale bar, 10 µm. n=3 independent experiments from 2 biological replicates. B, Quantification of nuclear H3K9me3 and H3K27me3 intensity in young and senescent cells. Normality was confirmed for H3K9me3 with the Shapiro-Wilk test; unpaired t test and P value. Normality was rejected for H3K27me3; Mann-Whitney U test and P value. C, Western blot showed prelamin A expression and decrease of H3K9me3 and H3K27me3 levels and increase of p16 in senescent cells. D, Representative immunofluorescence images of VSMCs treated with adenoviral mPLA (prelamin A) or adenoviralEGFP (enhanced green fluorescent protein) control before processing for indirect immunofluorescence using anti-H3K9me3 or anti-H3K27me3 antibodies in conjunction with anti-Flag antibodies and DAPI (4′,6-diamidino-2-phenylindole) counterstain. n=3 independent experiments from 3 biological replicates. Scale bar 20 µm. E, Quantification of the nuclear intensity of H3K9me3 and H3K27me3 in control vs mPLA-treated VSMCs showed that prelamin A reduced nuclear levels of H3K9me3 and H3K27me3. n=3 independent experiments in 2 biological replicates. Normality was rejected with Shapiro-Wilk test; Mann-Whitney U test and P value. F, Western blotting showed reduction of H3K9me3 and H3K27me3 and increased p16 protein levels upon PLA expression. G, Gene profiling arrays show downregulation of epigenetic regulators upon mPLA expression, which overlaps with the gene expression pattern in senescent VSMCs. Boxes indicate position of SUV39H1 (suppressor of variegation 3–9 homolog 1) and EZH2 (enhancer of zeste 2 PRC polycomb repressive complex 2 subunit). Black line indicates unchanged expression and dashed lines indicate a cutoff of 1.4-fold change above and below the threshold. H, Heat maps showing gene expression profiles of epigenetic regulators in senescent and mPLA-expressing VSMCs highlighting changes in heterochromatin modifiers (arrowed). PRC1 indicates polycomb repressive complex1; PRC2, polycomb repressive complex 2; and SET2, SET domain–containing 2, histone lysine methyltransferase.
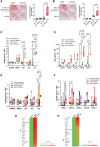
Figure 2.
Figure 2.
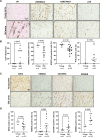
Aged and chronic kidney disease (CKD) vessels show decreased H3K9me3 (histone H3, lysine 9, trimethylation) and H3K27me3 (histone H3, lysine 27, trimethylation) and perturbed expression of epigenetic regulators. A, Representative immunohistochemical images of normal and calcified aortic sections stained for H3K9me3, H3K27me3, and p16, showing reduction in nuclei positive for H3K9me3 and H3K27me3 in aged specimens, concurrent with positive labeling for p16. Calcium deposits in aged aorta sections labeled with von Kossa (VK) staining. Scale bar 50 µm. B, Quantification of calcium deposition detected by VK staining percent of cells positive for nuclear H3K9me3, H3K27me3, and p16. Significance was analyzed by Mann-Whitney U test, and P values are shown. C, Representative immunohistological images of aortic sections stained for histone methyltransferases SUV39H1 (suppressor of variegation 3–9 homolog 1) and EZH2 (enhancer of zeste 2 polycomb repressive complex 2 subunit) and histone demethylases KDM (lysine demethylase) 4A and 6B. Aged specimens showed reduction in nuclei positive for EZH2, concurrent with increase in nuclei positive for KDM4A and KDM6B. Scale bar 50 µm. D, Quantification of percent nuclei positive for KDM4A, KDM6B, SUV39H1, and EZH2. Significance was analyzed by the Mann-Whitney U test and P values are shown. n indicates numbers as indicated.
Figure 3.
Figure 3.
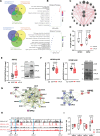
Chromatin immunoprecipitation followed by sequencing (ChIP-Seq) analysis reveals epigenetic derepression on potential mPLA (prelamin A) targets. A, top, Overlap between upregulated genes in microarray analysis and ChIP-gene annotations found exclusively in wild-type (WT) samples indicate 253 potential gene targets derepressed after reduction in H3K9me3 (histone H3, lysine 9, trimethylation) and H3K27me3 (histone H3, lysine 27, trimethylation) modifications. Bottom, Overlap between downregulated genes in microarray analysis and ChIP-gene annotations found exclusively in mPLA samples indicate 584 potential gene targets repressed after reduction in H3K9me3 and H3K27me3 histone modifications. B, Gene Ontology analysis of upregulated (253) and downregulated (584) gene targets revealed associations with altered insulin receptor signaling and DNA-binding activities, as top-scoring terms. C, Gene network analyses showing homeodomain-interacting protein kinase 2 (HIPK2) crosstalk with p53 and NF-κB (nuclear factor κB) signaling pathways. D, Nuclear factor of kappa light polypeptide gene enhancer in B cells 1 (NFKB1) and HIPK2 gene expression validation by quantitative real-time polymerase chain reaction (RT-PCR; n=4 from 3 isolates). Mixed model analysis and q values adjusted for multiple testing with Benjamini, Krieger, and Yekutieli false discovery rate (FDR) correction are shown. E, Western blot showed HIPK2 protein expression was increased in mPLA-expressing samples. n=12 biological repeats from 3 isolates. Normality was confirmed with the Shapiro-Wilk test; unpaired t test and P value shown. F, NFKB1 protein (precursor 105 kDa transcription inhibitor [p105] and cleaved from p50) was decreased in mPLA-expressing samples. n=12 biological repeats from 3 isolates. Normality was confirmed with the Shapiro-Wilk test; unpaired t test and P value shown. G, HIPK2, and NFKB1 regulate DNA damage repair signaling, senescence, and inflammation by String network. H, ChIP-Seq analysis showed that repressive histone marks were reduced at the gene loci encoding senescence-associated secretory phenotype proteins. I, RT-PCR showing increased expression of growth-related oncogene (GRO) locus genes in response to mPLA. n=4 biological repeats from 2 isolates. Mixed model analysis and q values adjusted for multiple testing with Benjamini, Krieger, and Yekutieli FDR correction are shown. ATM indicates ataxia-telangiectasia mutated; CDC, cell division cycle; CDKN, cyclin dependent kinase inhibitor; CHEK, checkpoint kinase; CXCL, C-X-C motif chemokine ligand; EGFP, enhanced green fluorescent protein; H2AFX, H2A.X variant histone; HUS, checkpoint clamp component; IL, interleukin; MDM, protoncogene, E3 ubiquitin protein ligase; MRE, double strand break repair nuclease; MYC, myc protooncogene, BHLH transcription factor; RAD, checkpoint clamp component; TP53, tumor protein P53; and TP53BP, tumor protein P53 binding protein.
Figure 4.
Figure 4.
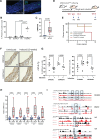
Vascular smooth muscle cell (VSMC)–specific mPLA (prelamin A) expression in vivo results in early reduction in heterochromatin marks. A and B, Immunofluorescence showing induction of PLA expression in VSMCs upon tamoxifen treatment (2 weeks). B, PLA was significantly increased upon tamoxifen treatment. N=4 in the uninduced group and n=5 in the tamoxifen-induced group. Mann-Whitney U test P values are shown. C, Lamin A/C (LMNA) transcript was increased significantly in the tamoxifen-induced group (mPLA). N=6. Mann-Whitney U test P values are shown. D, Experimental design of tamoxifen induction of mPLA-transgenic (Tg) mice or control littermates. E, Survival of uninduced and induced mPLA-Tg mice (control n=14 and mPLA-Tg n=6). F, Representative immunostaining of H3K9me3 (histone H3, lysine 9, trimethylation) and H3K27me3 (histone H3, lysine 27, trimethylation) in aortas from uninduced and induced mPLA-Tg mice at 2 weeks. Scale bar, 10 mm. n=5 mice per group. G, Quantification of H3K9me3 and H3K27me3 in aortas from uninduced and induced mPLA-Tg mice at 2 and 10 weeks. Normality confirmed with Shapiro-Wilk test; Mann-Whitney U test P values are shown. H, Quantitative real-time polymerase chain reaction showing increased expression of osteogenic genes, senescence-associated secretory phenotype genes, and cyclin dependent kinase inhibitor 2A (CDKN2A) in mPLA-Tg expressing mice (4 weeks). N=7 mice per group. Mann-Whitney U test P values are shown. I, chromatin immunoprecipitation followed by sequencing analysis showed that repressive histone marks were reduced at the gene loci encoding genes upregulated by PLA expression in H. BMP 2 indicates bone morphogenetic protein 2; IHC, immunohistochemistry; IL, interleukin; Runx2, runt-related transcription factor 2; Tg, transgenic; and WT, wild-type.
Figure 5.
Figure 5.
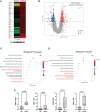
Mice expressing mPLA (prelamin A) show early induction of chemokine signaling and accelerated calcification. A, Heat map showing differentially expressed genes in mPLA-Tg expressing mice vs uninduced controls shown as fold change. B, Volcano plot showing significantly upregulated and downregulated genes. Cut off: log2FC=0.5 with P=0.05. Indicated genes have previously been shown to have a role in vascular calcification or were selected for validation by quantitative real-time polymerase chain reaction (qRT-PCR). C and D, Gene Ontology analysis pathways significantly altered in response to PLA expression. E, qRT-PCR verification of differential gene expression in mouse aorta expressing mPLA-transgenic (Tg). n=7 mice per group. Mann-Whitney U test P value shown. CCR indicates C-C motif chemokine receptor; CXCL7, C-X-C motif chemokine ligand 7; MMP, matrix metalloproteinase; TUBB3, tubulin beta 3; VSNL1, visinin-like 1; and WT, wild-type.
Figure 6.
Figure 6.
Vascular smooth muscle cells (VSMCs) display early senescence-associated secretory phenotype (SASP) activation during calcification, which is correlated to reduction in H3K9me3 (histone H3, lysine 9, trimethylation) and H3K27me3 (histone H3, lysine 27, trimethylation) modifications. A, VSMCs showed reduction in H2K9me3 and H3K27me3 during early calcification. Scale bar 10 µm. B, Quantification of nuclear intensities of H3K9me3 and H3K27me3 immunostaining in VSMCs treated with control media (Control) or calcifying calcium and phosphate (Ca/P) media. n=3 independent experiments from 3 isolates. Kruskal-Wallis test and P value are shown. C, Increasing PLA expression during VSMC calcification. Quantification of nuclear intensities of PLA immunostaining in VSMCs at the different stages of calcification shown as relative calculated corrected total cell fluorescence (CTCF). n=4 independent experiments from 2 isolates. Kruskal-Wallis test and P value are shown. D, Heat map of expression changes of selected epigenetic regulators from polymerase chain reaction array over the time course of calcification. H3K9m3 and H3K27me3 regulators are boxed. SUV39H1 (suppressor of variegation 3-9 homologue 1), EZH2 (enhancer of zeste 2 homologue 2), KDM (lysine demethylase) 6B and 4A. E, In response to calcifying media VSMCs upregulate osteogenic markers at the late calcification stage. n=6 independent experiments from 3 biological replicates. Kruskal-Wallis test and q values adjusted for multiple testing with Benjamini, Krieger, and Yekutieli false discovery rate (FDR) correction are shown. F and G, Robust SASP activation occurs at the early calcification stage. n=6 independent experiments from 3 biological replicates. Kruskal-Wallis test and q values adjusted for multiple testing with Benjamini, Krieger, and Yekutieli FDR correction are shown. H, Conditioned media from VSMCs treated with calcifying calcium and phosphate (Ca/P) media were harvested at each stage of calcification for antibody cytokine array analysis. Densitometry was performed and normalized to control conditions. Heat maps show fold changes for the top 20 upregulated cytokines from each stage of calcification compared to control for each timepoint. n=2 for precalcification, n=1 for early calcification and n=2 for late calcification. Arrows indicate abundant cytokines released across the timecourse. Arrows indicate factors increased across the timecourse and implicated in calcification. BSP indicates integrin-binding sialoprotein; CCL CC chemokine ligand; CXCL, BMP bone morphogenetic protein; C-X-C motif chemokine ligand; FGF, fibroblast growth factor; HGF, hepatocyte growth factor; IGFBP, insulin like growth factor binding protein; IL, interleukin; LIF, leukemia inhibitory factor; Msx2, Msh homeobox 2; NT, neurotrophin; PDGF, platelet derived growth factor; PIGF, phosphatidylinositol glycan anchor biosynthesis class F; Runx2, runt-related transcription factor 2; TGF, transforming growth factor; TIMP, tissue inhibitor of metalloproteinase; and TNF, tumor necrosis factor.
Figure 7.
Figure 7.
SUV39H1 (suppressor of variegation 3–9 homolog 1) and EZH2 (enhancer of zeste 2 polycomb repressive complex 2 subunit) inhibitors accelerate vascular smooth muscle cell (VSMC) calcification in vitro and induce senescence-associated secretory phenotype (SASP) activation. A and B, Representative images of Alizarin Red staining of calcified cells and quantification of calcium accumulation after treatment with chaetocin (A) or GSK126 (B). Ctrl, control media, Vehicle, dimethyl sulfoxide (DMSO) control. n=3 independent experiments in 2 biological replicates. Significance was analyzed by Mann-Whitney U test and P values are shown. C through F, Gene expression changes quantified by quantitative real-time polymerase chain reaction (qRT-PCR; normalized to 18S expression) showed an increase in SASP genes after treatment with EZH2 or SUV39H1 inhibitors under control or calcium and phosphate (Ca/P) conditions. n=3 for Chaetocin treatment and n=4 for GSK126 treatment from 3 biological replicates. Mixed model analysis and q values adjusted for multiple testing with Benjamini, Krieger, and Yekutieli false discovery rate (FDR) correction. G and H, Conditioned media of VSMCs treated with high Ca/P media in the presence or absence of Chaetocin (6 days) and GSK126 (3 days) were collected and used for cytokine antibody arrays. The top 20 upregulated chemokines (2 independent experiments) are presented as heat maps compared with control cells without drug treatment. Arrow denotes upregulated secretion of CXCL7 (C-X-C motif chemokine ligand 7) upon treatment with chaetocin and GSK126. IL indicates interleukin; Msx2, Msh homeobox 2; and Runx2, runt-related transcription factor 2.
Figure 8.
Figure 8.
Reduction of repressive histone marks determined in patients with chronic kidney disease (CKD) and rat CKD model. A, Representative immunostaining of H3K9me3 (histone H3, lysine 9, trimethylation) and H3K27me3 (histone 3, lysine 27, trimethylation) in aortas from control (non-CKD) and children with CKD. Scale bar=20 µm. B, Quantification of percent positive nuclei showed H3K27me3 was reduced in patients with CKD. Red dots in CKD group represent predialysis patients. Significance was analyzed by Mann-Whitney U test and P value is shown. C, Representative images of von Kossa (VK) stain and immunostaining for repressive histone marks and PLA (prelamin A) in calcified and noncalcified aortas from CKD rats. Arrows indicate the same area in serial sections showing PLA accumulation and loss of heterochromatin marks at calcification sites. D, Percent positive nuclei for H3K9me3 and H3K27me3 in CKD rats at time points 2, 4, 6, and 8 weeks after exposure to adenine diet showing reduction in H3K27me3 at 6 and 8 weeks. n numbers are indicated. Mixed model analysis and q values adjusted for multiple testing with Benjamini, Krieger, and Yekutieli false discovery rate (FDR) correction are shown. E, Percent positive nuclei for H3K9me3 and H3K27me3 in control and CKD rats pooled from 4, 6, and 8 weeks comparing calcified and noncalcified aorta. Kruskal-Wallis test and P value are shown. F, PLA expression in control and CKD rats pooled from 4, 6, and 8 weeks comparing calcified and noncalcified aorta. Kruskal-Wallis test and P value are shown. G, Spearman correlation analysis of calcification and PLA in pooled CKD rats. M indicates media.

Comment in

References

    1. Lopez-Otin C, Blasco MA, Partridge L, Serrano M, Kroemer G. The hallmarks of aging. Cell. 2013;153:1194–1217. doi: 10.1016/j.cell.2013.05.039 - PMC - PubMed
    1. van Deursen JM. The role of senescent cells in ageing. Nature. 2014;509:439–446. doi: 10.1038/nature13193 - PMC - PubMed
    1. McHugh D, Gil J. Senescence and aging: causes, consequences, and therapeutic avenues. J Cell Biol. 2018;217:65–77. doi: 10.1083/jcb.201708092 - PMC - PubMed
    1. Baker DJ, Childs BG, Durik M, Wijers ME, Sieben CJ, Zhong J, Saltness RA, Jeganathan KB, Verzosa GC, Pezeshki A, et al. . Naturally occurring p16(Ink4a)-positive cells shorten healthy lifespan. Nature. 2016;530:184–189. doi: 10.1038/nature16932 - PMC - PubMed
    1. Sutton NR, Malhotra R, Hilaire CS, Aikawa E, Blumenthal RS, Gackenbach G, Goyal P, Johnson A, Nigwekar SU, Shanahan CM, et al. . Molecular mechanisms of vascular health: insights from vascular aging and calcification. Arterioscler Thromb Vasc Biol. 2023;43:15. doi: 10.1161/ATVBAHA.122.317332 - PMC - PubMed

MeSH terms

LinkOut - more resources