. 2025 Mar;12(10):e2406759.
doi: 10.1002/advs.202406759. Epub 2025 Jan 22.

Nuclear Condensates of WW Domain-Containing Adaptor With Coiled-Coil Regulate Mitophagy via Alternative Splicing

Affiliations

Nuclear Condensates of WW Domain-Containing Adaptor With Coiled-Coil Regulate Mitophagy via Alternative Splicing

Jiahe Wang et al. Adv Sci (Weinh). 2025 Mar.

Abstract

Biomolecular condensates segregate nuclei into discrete regions, facilitating the execution of distinct biological functions. Here, it is identified that the WW domain containing adaptor with coiled-coil (WAC) is localized to nuclear speckles via its WW domain and plays a pivotal role in regulating alternative splicing through the formation of biomolecular condensates via its C-terminal coiled-coil (CC) domain. WAC acts as a scaffold protein and facilitates the integration of RNA-binding motif 12 (RBM12) into nuclear speckles, where RBM12 potentially interacts with the spliceosomal U5 small nuclear ribonucleoprotein (snRNP). Importantly, knockdown of RBM12, or deletion of the WAC CC domain led to altered splicing outcomes, resulting in an elevated level of BECN1-S, the short splice variant of BECN1 that is shown to upregulate mitophagy. Thus, the findings reveal a previously unrecognized mechanism for the nuclear regulation of mitochondrial function through liquid-liquid phase separation (LLPS) and provide insights into the pathogenesis of WAC-related disorders.

Keywords: WAC; mitophagy; nuclear speckles; phase‐separated biomolecular condensates; pre‐mRNA splicing; snRNP.


Conflict of interest statement

The authors declare no conflict of interest.

Figures

Figure 1
Figure 1
WAC colocalizes with nuclear speckles and regulates alternative splicing. a) Immunofluorescence assays were conducted to visualize the colocalization of endogenous WAC with the endogenous nuclear speckle markers SC35 and SON. The Pearson correlation coefficient was used to assess the overlap between each fluorescence signal in the nucleus region. Green boxes contain the 25th to 75th percentiles of the dataset (n = 15). Black whiskers mark the 10th and 90th percentiles. Outliers are marked with black dots. b) Immunofluorescence assays were conducted to visualize the colocalization of eGFP‐tagged WAC with the endogenous nuclear speckle markers SC35 and SON. Scale bar = 2 µm. c) Quantification of DASEs affected by WAC. d) Gene ontology of WAC‐regulated AS targets. e) Validation of randomly selected AS events by semi‐quantitative RT‐PCR and quantification of relative splicing efficiency of representative mRNAs upon WAC knockout in HeLa cells. The relative Inc/Skip (inclusion band/exclusion band) ratio was plotted (n = 3, Student's t‐test). * p < 0.05; ** p < 0.01; *** p < 0.001 **** p < 0.0001. The results are from more than three independent experiments. Values are mean ± SD.
Figure 2
Figure 2
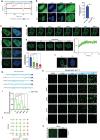
WAC forms biomolecular condensates in vivo and in vitro. a) PONDR (www.pondr.com) prediction of intrinsically disordered regions (IDRs) of WAC domain architectures is shown. b) Representative images of HeLa cells transfected with eGFP‐WAC and eGFP plasmids. The percentage of nuclear condensates formed in cells expressing fluorescent proteins from three independent experiments is shown (n = 15, Student's t‐test). Scale bar = 10 µm. c) Representative images showing the effects of eGFP‐WAC plasmid transfection in HeLa cells with or without 1,6‐hexanediol (1,6‐HD) treatment (5%, 1, 5, and 30 min). The number of condensates formed per cell with or without 1,6‐HD treatment was quantified in three independent experiments (n = 15, Student's t‐test). Scale bar = 2 µm. d) Images of two fusion events (arrowheads) among WAC condensates. See Video S1 (Supporting Information). e) Representative time‐lapse images with magnified insets showing the fluorescence recovery after photobleaching (FRAP) of eGFP‐WAC puncta. The curve on the right shows the relative quantification of the fluorescence signal recorded pre‐ and postbleach (n = 6). Scale bar = 5 µm. f) Immunofluorescence assays were conducted to inspect the nuclear condensation of endogenous WAC. Scale bar = 2 µm. g) Diagram of domain mapping of four truncated versions of human WAC mutants. h) In vitro condensate formation of purified full‐length and 4 truncated WAC fusion proteins at various protein concentrations (0.25, 0.5, 1, 2, or 4 µm). Scale bar =5 µm. i) The quantification of the droplets shown in Figure 2h. Droplets in each group were quantified (n = 5, one‐way ANOVA). j) Phase diagram of Figure 2h. k) In vitro condensate formation of purified full‐length WAC fusion proteins with or without 1,6‐hexanediol (1,6‐HD) treatment. Scale bar = 10 µm. * p < 0.05; ** p < 0.01; *** p < 0.001; **** p < 0.0001. The results are from more than three independent experiments. Values are mean ± SD.
Figure 3
Figure 3
The coiled‐coil domain of WAC drives condensate formation. a) Fluorescence images of HeLa cells transfected with full‐length and 4 truncated versions of WAC with eGFP. Scale bar = 2µm. b) The percentage of cells that displayed cellular puncta is shown on the right. The percentage of cellular condensates expressing fluorescent proteins from three independent experiments is shown (n = 15, one‐way ANOVA). Scale bar = 2 µm. c) Experimental workflow of light‐induced optoDroplet formation of Cry2‐mCherry‐WAC. Diagram of domain mapping of the plasmid used in the optoDroplet assay. d) Representative images of opto‐Droplet formation before and after light induction are shown. Scale bar = 10 µm. e‐f) Quantification of the droplets formed by Opto‐Control or Opto‐WAC before and after light induction is shown. Seven transfected cells in each group were randomly selected and quantified (n = 7, one‐way ANOVA). g‐h) Representative time‐lapse images with magnified insets showing the FRAP recovery of puncta formed by Cry2‐mCherry‐WAC or Cry2‐mCherry. The curve on the right shows the relative quantification of the fluorescence signal recorded pre‐ and postbleach (n = 3). Scale bar = 5 µm. i‐j) Diagram of 2 truncated domain maps of human WAC mutants. Immunofluorescence images of HeLa cells transfected with eGFP‐WAC‐YAP CC and eGFP‐WAC‐5LE with SC35. Scale bar = 2 µm. k) Immunofluorescence images of HeLa cells transfected with eGFP‐WACΔIDR1‐NLS and SC35. Scale bar = 5 µm. * p < 0.05; ** p < 0.01; *** p < 0.001; **** p < 0.0001. The results are from more than three independent experiments. Values are mean ± SD.
Figure 4
Figure 4
Mass spectrometry identified RBM12 as an interacting protein of eGFP‐WAC. a) A schematic diagram illustrating the immunoprecipitation–mass spectrometry procedure used in this study is shown. b) Heatmap of identified eGFP‐WAC‐interacting proteins. c) Mass spectrometry analysis of eGFP‐WAC immunoprecipitates. Selected peptide hits and unused scores are shown. A higher unused score means more credibility. d) Immunofluorescence assays were conducted to evaluate the colocalization of eGFP tag or eGFP‐tagged WAC and endogenous WAC with endogenous RBM12. The Pearson correlation coefficient was used to assess the overlap between each fluorescence signal in the nucleus region. Green boxes contain the 25th to 75th percentiles of the dataset. Black whiskers mark the 10th and 90th percentiles. Outliers are marked with black dots. Scale bar = 2 µm.
Figure 5
Figure 5
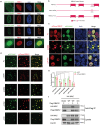
WAC interacts with the client protein RBM12 to cause co‐phase separation. a) Immunofluorescence images of HeLa cells transfected with 4 truncated versions of WAC with eGFP and endogenous RBM12. Nuclei were stained with 4’,6‐diamidino‐2‐phenylindole (DAPI). Scale bar = 2 µm. b) Diagram of 3 truncated domain maps of human RBM12 mutants. Human RBM12 contains 3 RNA recognition motifs (RRMs) and 1 proline‐rich linker region. c) Coexpression of 3 truncated versions of RBM12 with mCherry and eGFP‐WAC. Nuclei were stained with DAPI. Scale bar = 10 µm. d) In vitro condensate formation of purified full‐length or 4 truncated versions of eGFP–WAC (10 µM) mixed with 10 µm WT mCherry–RBM12. Scale bar = 5 µm. e) The quantification of the droplets is shown in Figure 5D. Droplets in each group were quantified (n = 5, two‐way ANOVA). f) The ability of HA‐tagged wild‐type WAC or WACΔCC to interact with Flag–RBM12 was examined using a coimmunoprecipitation assay with anti‐Flag antibodies via immunoprecipitation (IP), followed by western blotting with anti‐HA antibodies (top). The abundance of these proteins in the cell lysates was examined using western blotting (bottom). * p < 0.05; ** p < 0.01; *** p < 0.001; **** p < 0.0001. The results are from more than three independent experiments. Values are mean ± SD.
Figure 6
Figure 6
WAC integrates RBM12 into nuclear speckles. a‐d) Immunofluorescence images of HeLa cells transfected with full‐length WAC and 4 truncated versions of WAC with eGFP and endogenous SC35. Nuclei were stained with 4’,6‐diamidino‐2‐phenylindole (DAPI). Scale bar = 2 µm. e) Immunofluorescence images of HeLa cells transfected with full‐length and 4 truncated versions of WAC with eGFP and both endogenous SC35 and RBM12. Nuclei were stained with DAPI. Scale bar = 2µm. f) In vitro cophase separation of mCherry‐RBM12 with eBFP‐SC35. The reactions were performed in 150 mm NaCl (pH 7.0). g) In vitro cophase separation of eGFP‐WAC with mCherry‐RBM12 and eBFP‐SC35. The reactions were performed in 150 mm NaCl (pH 7.0). h) Coomassie blue staining of SDS‒PAGE gel showing the purity of SC35 fused to eBFP.
Figure 7
Figure 7
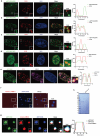
WAC‐related alternative splicing (AS) regulates mitophagy. a) Volcano plot showing the distribution of differential alternative splicing events (DASEs) between WAC knockout (KO) cells re‐expressing full‐length Flag‐WAC and WAC KO cells re‐expressing Flag‐WACΔCC. b) Quantification of DASEs between WAC KO cells re‐expressing full‐length Flag‐WAC and WAC KO cells re‐expressing Flag‐WACΔCC. c) Gene Ontology (GO) analysis of Biological Processes in WAC KO cells expressing full‐length Flag‐WAC vs. WAC KO cells expressing Flag‐WACΔCC. d) Venn diagram of the DASEs of mitophagy‐related genes in the two groups according to GO analysis (group 1: siNC vs. siRBM12; group 2: WAC‐KO WAC cells re‐expressing full‐length Flag‐WAC vs. WAC‐KO cells re‐expressing Flag‐WACΔCC). e‐f) Validation of AS events of BECN1 by semi‐quantitative RT‒PCR in wild‐type HeLa cells, WAC‐KO Cas9 cells, WAC knockout (KO) cells re‐expressing full‐length Flag‐WAC and WAC KO cells re‐expressing Flag‐WACΔCC. The relative Inc/Skip (inclusion band/exclusion band) ratio was plotted (n = 3, Student's t‐test). g) Mitophagy levels were detected by Mtphagy dye and LysoTracker in WT HeLa cells and WAC KO cells. Scale bar = 5 µm. The quantification of the mean cellular fluorescence intensity of Mtphagy Dye staining that colocalizes with LysoTracker. Cells from three independent experiments were randomly selected and quantified (n = 15, Student's t‐test). Scale bar = 5 µm. h) Representative images of mitochondria that are selectively sequestered within autophagosomes in each group. Scale bar = 2 µm. I) Immunoblotting of BECN1‐S‐associated PINK1/Parkin pathway components in wild‐type HeLa cells, WAC‐KO Cas9 cells, WAC knockout (KO) cells re‐expressing full‐length Flag‐WAC and WAC KO cells re‐expressing Flag‐WACΔCC. Beta‐actin was used as an internal control. * p < 0.05; ** p < 0.01; *** p < 0.001; **** p < 0.0001. The results are from more than three independent experiments. Values are mean ± SD.
Figure 8
Figure 8
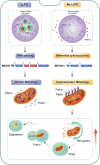
A model of enhanced mitophagy regulated by alternative splicing driven by nuclear condensation of WAC.

References

    1. Hirose T., Ninomiya K., Nakagawa S., Yamazaki T., Nat. Rev. Mol. Cell Biol. 2023, 24, 288. - PubMed
    1. Galganski L., Urbanek M. O., Krzyzosiak W. J., Nucleic Acids Res. 2017, 45, 10350. - PMC - PubMed
    1. Yamazaki T., Nakagawa S., Hirose T., Cold Spring Harb. Symp. Quant. Biol. 2019, 84, 227. - PubMed
    1. Regan‐Fendt K. E., Izumi K., Hum. Genet. 2023, 143, 529. - PubMed
    1. Zhang Q., Kota K. P., Alam S. G., Nickerson J. A., Dickinson R. B., Lele T. P., J. Cell. Physiol. 2016, 231, 1269. - PMC - PubMed

LinkOut - more resources