. 2025 Feb;34(2):e70036.
doi: 10.1002/pro.70036.

Translation of the downstream ORF from bicistronic mRNAs by human cells: Impact of codon usage and splicing in the upstream ORF

Affiliations

Translation of the downstream ORF from bicistronic mRNAs by human cells: Impact of codon usage and splicing in the upstream ORF

Philippe Paget-Bailly et al. Protein Sci. 2025 Feb.

Abstract

Biochemistry textbooks describe eukaryotic mRNAs as monocistronic. However, increasing evidence reveals the widespread presence and translation of upstream open reading frames preceding the "main" ORF. DNA and RNA viruses infecting eukaryotes often produce polycistronic mRNAs and viruses have evolved multiple ways of manipulating the host's translation machinery. Here, we introduce an experimental model to study gene expression regulation from virus-like bicistronic mRNAs in human cells. The model consists of a short upstream ORF and a reporter downstream ORF encoding a fluorescent protein. We have engineered synonymous variants of the upstream ORF to explore large parameter space, including codon usage preferences, mRNA folding features, and splicing propensity. We show that human translation machinery can translate the downstream ORF from bicistronic mRNAs, albeit reporter protein levels are thousand times lower than those from the upstream ORF. Furthermore, synonymous recoding of the upstream ORF exclusively during elongation significantly influences its own translation efficiency, reveals cryptic splice signals, and modulates the probability of downstream ORF translation. Our results are consistent with a leaky scanning mechanism facilitating downstream ORF translation from bicistronic mRNAs in human cells, offering new insights into the role of upstream ORFs in translation regulation.

Keywords: GFP; RNA splicing; bicistronic mRNA; codon usage; downstream ORF; elongation; eukaryote; fluorescence; main ORF; polycistronic mRNA; transcription; translation; upstream ORF.


Conflict of interest statement

The authors declare that they have no conflicts of interest with the contents of this article.

Figures

FIGURE 1
FIGURE 1
(a) Cartoon of the synonymous recoding strategy for our constructs. All synonymous versions of the shble ORF are located in a bicistronic mRNA in tandem with the egfp ORF downstream, and under the transcriptional control of the cytomegalovirus (CMV)‐ promoter. The shble ORF is preceded by an invariant stretch of 18 nucleotides encoding for an AU1 epitope. Synonymous shble variants explore a sequence space associated to differences in GC3, CpG and TpA composition, as well as in match to the average human codon usage preferences and mRNA folding energy. (b) First two axes of a principal component analysis (PCA) of the compositional variables for the 13 shble versions used. The percentage of the total variance captured by each axis is given in parenthesis. GC3, percentage of G or C at the third codon nucleotide codons; freq_CpG, CpG dinucleotide frequency; freq_TpA. TpA dinucleotide frequency; folding, energy of the more stable structure predicted for the mRNA shble ORF estimated with UNAfold online tool (http://unafold.org) (Markham & Zuker, 2008); COUSIN_59, value of the COdon Usage Similarity Index of the shble version with respect to the average human codon usage (Bourret et al., 2019).
FIGURE 2
FIGURE 2
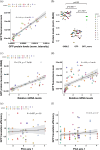
Compositional variation of synonymous shble versions does not affect mRNA levels. (a) Box‐and‐whiskers plot showing relative levels of total heterologous mRNAs measured by RT‐qPCR from four or eight biological replicates. Within a given replicate, relative mRNA level values were normalized by the median value of all samples, allowing comparison across replicates. The positive control “empty” condition transcribed a monocistronic egfp mRNA while the 13 shble conditions (sh1 to sh13) transcribed a bicistronic shble_egfp mRNA. Letters present the results of a pairwise Wilcoxon rank sum test with B–H adjusted p‐values. Median values for samples labeled with the same letter are not statistically different (α = 0.05). (b) Pearson's linear regression (black line) and 95% confidence interval of the fit (gray) between the projection on the first axis of PCA in Figure 1 for each shble version, and the relative mRNA levels.
FIGURE 3
FIGURE 3
(a) SHBLE protein levels as a function of mRNA levels. Pearson's linear regression (black line) and 95% confidence interval of the fit (gray) between relative shble_egfp mRNA levels and relative GFP protein levels for the 13 shble synonymous versions. (b) SHBLE translation efficiency as a function of shble sequence characteristics. Pearson's linear regression (black line) and 95% confidence interval of the fit (gray) between the projection on the first axis of PCA in Figure 1 for each shble version, and the protein‐over‐mRNA ratio for data presented in panel (a). For all, values from a same biological replicate are represented by triangle, rectangle or circle shapes.
FIGURE 4
FIGURE 4
(a) GFP production from synonymous versions of a bicistronic shble_egfp mRNA. Pearson's linear regression (black line) and 95% confidence interval of the fit (gray) between proteomic‐based, sample‐normalized GFP intensity levels and the sum of fluorescence intensity of the cellular population for the 13 shble versions. Sums of fluorescence were calculated by integrating the fluorescence signal of 30,000 randomly selected cells in each transfection event. (b) Dot‐plot showing relative levels of heterologous proteins measured by label‐free proteomic from three biological replicates. For each sample, iBAQ values of SHBLE and GFP were normalized by the total iBAQ value of the sample. The positive control “GFP_mono” condition translated GFP from a monocistronic egfp mRNA while the 13 shble conditions translated SHBLE and GFP from a bicistronic shble_egfp mRNA. GFP values do not follow a normal distribution after a Shapiro normality test (p = 0.0014), hence the p‐values present the results of a pairwise Wilcoxon signed rank exact test. (c) Pearson's linear regression (black line) and 95% confidence interval of the fit (gray) between relative shble_egfp mRNA levels and proteomic‐based GFP levels for the 13 shble synonymous versions. (d) Pearson's linear regression (black line) and 95% confidence interval of the fit (gray) between relative shble_egfp mRNA levels and fluorescence‐based GFP levels for the 13 shble synonymous versions. (e) Pearson's linear regression (black line) and 95% confidence interval of the fit (gray) between the projection on the first axis of PCA in Figure 1 for each shble version, and egfp translation efficiency calculated with proteomic data. (f) Pearson's linear regression (black line) and 95% confidence interval of the fit (gray) between the projection on the first axis of PCA in Figure 1 for each shble version, and egfp translation efficiency calculated with fluorescence data. For panels (a), (c), (e), and (f), values from a same biological replicate are represented by triangle, rectangle or circle shapes.
FIGURE 5
FIGURE 5
Relative SHBLE and GFP production from bicistronic shble_egfp mRNA. (a) Box‐and‐whiskers plot of the SHBLE/GFP proteins ratio for the 13 shble versions, stratified by their match to the average CUPrefs of the human genome. Letters present the results of a pairwise Wilcoxon rank sum test with B–H adjusted p‐values; α = 0.05; median values for samples labeled with the same letter are not statistically different. (b) Pearson's linear regression (black line) and 95% confidence interval of the fit (gray) between the projection on the first axis of PCA in Figure 1 for each shble version, and the SHBLE‐over‐GFP proteins levels. (c) Pearson's linear regression (black line) and 95% confidence interval of the fit (gray) between SHBLE translation efficiency and GFP translation efficiency. For panels (b) and (c), values from a same biological replicate are represented by triangle, rectangle or circle shapes.
FIGURE 6
FIGURE 6
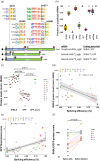
Effect of shble_egfp bicistronic mRNA splicing on SHBLE and GFP protein levels. (a) Schematic representation of unspliced and spliced bicistronic mRNAs generated for shble versions shble#4, #6, #7, #10, and #13 and their respective original (splice‐able) or mutated (splice‐ablated) sequences. Figure should be read as follows, using shble#4 as an example: “sh4sp” refers to the sequence that undergoes splicing, while “sh4” refers to the sequence that has been mutated to ablate splicing. Splice donor (SD) and splice acceptor (SA) site positions relative to the shble AUG are indicated by discontinuous lines. (b) Box‐and‐whiskers plot showing the fraction of unspliced mRNA generated by splice‐able (e.g., “sh4sp”) and splice‐ablated (e.g., “sh4”) constructs, determined by Bioanalyzer. (c) Dot plot showing relative levels of heterologous proteins measured by label free proteomic from three biological replicates. For each sample, iBAQ values of SHBLE and GFP were normalized by the total iBAQ value of the sample. The positive control “GFP_mono” condition translated GFP from a monocistronic egfp mRNA while the 10 shble conditions translated SHBLE and GFP from a spliced or non‐spliced bicistronic shble_egfp mRNA, as specified by the color code. GFP values do not follow a normal distribution after a Shapiro normality test (p = 6.18e‐13), hence the p‐values present the probability that the medians of the groups are not different, after a pairwise Wilcoxon signed rank exact test (α = 0.05). (d) Pearson's linear regression (black line) and 95% confidence interval of the fit (gray) between proteomics‐based SHBLE levels and splicing efficiency, measured as fraction of spliced mRNA over total mRNA. (e) Pearson's linear regression (black line) and 95% confidence interval of the fit (gray) between fluorescence‐based EGFP levels and splicing efficiency, measured as fraction of spliced mRNA over total mRNA. (f) Connected dot‐plot showing SHBLE‐over‐GFP protein levels for the 10 splice‐able and splice‐ablated shble versions from three biological replicates. Paired differences between splice‐able and splice‐ablated versions were assessed using the Wilcoxon signed rank sum test (p = 4.27e‐4).

References

    1. Alexaki A, Kames J, Holcomb DD, Athey J, Santana‐Quintero LV, Lam PVN, et al. Codon and codon‐pair usage tables (CoCoPUTs): facilitating genetic variation analyses and recombinant gene design. J Mol Biol. 2019;431:2434–2441. - PubMed
    1. Alonso AM, Diambra L. Dicodon‐based measures for modeling gene expression. Bioinformatics. 2023;39:btad380. - PMC - PubMed
    1. Arike L, Valgepea K, Peil L, Nahku R, Adamberg K, Vilu R. Comparison and applications of label‐free absolute proteome quantification methods on Escherichia coli . J Proteomics. 2012;75:5437–5448. - PubMed
    1. Bauer AP, Leikam D, Krinner S, Notka F, Ludwig C, Längst G, et al. The impact of intragenic CpG content on gene expression. Nucleic Acids Res. 2010;38:3891–3908. - PMC - PubMed
    1. Bénitière F, Necsulea A, Duret L. Random genetic drift sets an upper limit on mRNA splicing accuracy in metazoans. Elife. 2024;13:RP93629. - PMC - PubMed

LinkOut - more resources