. 2025 Jan;14(1):e70037.
doi: 10.1002/jev2.70037.

A Non-Centrifugation Method to Concentrate and Purify Extracellular Vesicles Using Superabsorbent Polymer Followed by Size Exclusion Chromatography

Affiliations

A Non-Centrifugation Method to Concentrate and Purify Extracellular Vesicles Using Superabsorbent Polymer Followed by Size Exclusion Chromatography

Markus Bergqvist et al. J Extracell Vesicles. 2025 Jan.

Abstract

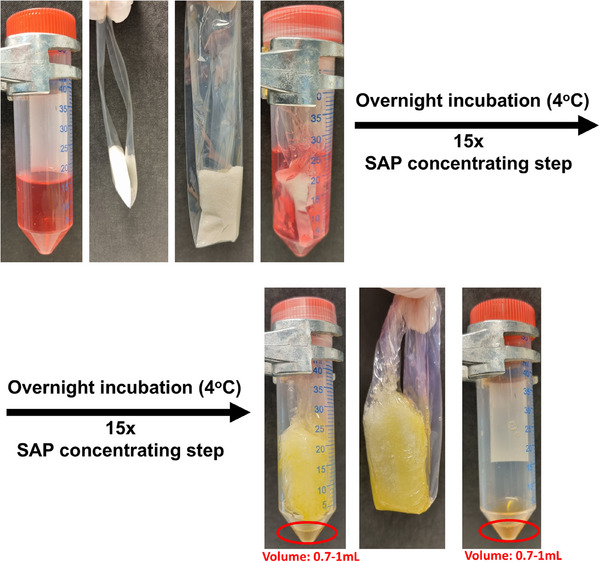
Extracellular vesicles (EVs) can be isolated and purified from cell cultures and biofluids using different methodologies. Here, we explored a novel EV isolation approach by combining superabsorbent polymers (SAP) in a dialysis membrane with size exclusion chromatography (SEC) to achieve high concentration and purity of EVs without the use of ultracentrifugation (UC). Suspension HEK293 cells transfected with CD63 coupled with Thermo Luciferase were used to quantify the EV yield and purity. The 500 mL conditioned medium volume was initially reduced by pressure ultrafiltration, followed by UC, SAP or a centrifugal filter unit (CFU). Using either of these methods, the EVs were concentrated to a final volume of approximately 1 mL, with retained functionality. The yield, quantified by luciferase activity, was highest with UC (70%-80%), followed by SAP (60%-70%) and CFU (50%-60%). Further purification of the EVs was performed by iodixanol density cushion (IDC) or SEC (Sepharose CL-2B or 6B, in either 10 or 20 mL columns). Although the IDC and Sepharose CL-2B (10 mL) achieved the highest yields, the purity was slightly higher (30%) with IDC. In conclusion, combining SAP concentration with CL-2B SEC is an alternative and efficient way to isolate EVs without using UC.

Keywords: EV isolation techniques; Thermo Luciferase; exosomes; non‐ultracentrifugation methods; size exclusion chromatography; superabsorbent polymers.


Figures

FIGURE 1
FIGURE 1
Overview of the workflow in this study. Cells and large debris were removed via slow centrifugation, and the supernatant was concentrated (10–25×) via ultrafiltration during initial processing. The volume was further reduced via one of three concentration steps: ultracentrifugation (UC), superabsorbent polymer (SAP) or centrifugal filter units (CFU). The extracellular vesicles were then purified, and contaminating proteins were removed with Sepharose size exclusion chromatography using two different materials and column lengths (2B‐10, 2B‐20, 6B‐10 and 6B‐20) or iodixanol density cushion (IDC).
FIGURE 2
FIGURE 2
Portrayal of the superabsorbent polymer concentrating step. The polymer was located inside a dialysis membrane that was lowered into RPMI medium in a 50 mL Falcon tube. The yellow colour appears when culture medium is absorbed by the polymer, and reflects change in pH (Free Style medium, used for the EV isolation, is colourless and does not well illustrate the absorption into the SAP). SAP, suberabsorbent polymer.
FIGURE 3
FIGURE 3
Yield and purity of the CD63 coupled Thermo Luciferase extracellular vesicles (T‐Luc EVs) using the methods for initial processing and concentration. (a) Yield of the pressure ultrafiltration step in the initial processing compared to the original unconcentrated materials luciferase signal. (b) Yields of the different methods in the concentration step compared to the luciferase signal in the initial processing. (c) Purity of the T‐Luc EVs after the different methods in the concentration step demonstrated as the number of particles per microgram of protein. Analysis by one‐way ANOVA was performed; * p < 0.05, ** p < 0.01, *** p < 0.001, **** p < 0.0001, N = 3. CFU, centrifugal filter units; SAP, superabsorbent polymer; UC, ultracentrifugation.
FIGURE 4
FIGURE 4
Analysis of all fractions after running supernatant with Thermo Luciferase extracellular vesicles (T‐Luc EVs) from the different concentration methods on Sepharose CL‐2B, 10 mL size exclusion chromatography (SEC) columns. The luciferase signal (blue) and protein concentration (red) for all fractions (using one entire batch of 500 mL culture supernatant with T‐Luc EVs for each concentration method; N = 2). (a) Supernatant after concentrating with ultracentrifugation (UC). (b) Supernatant after concentrating with superabsorbent polymer in a dialysis membrane (SAP). (c) Supernatant after concentrating with centrifugal filter units (CFU). (d) Particle concentration (NTA) versus luciferase signal for each of the fractions with T‐Luc EVs to determine the accuracy of the luciferase measurements via linear regression after EV‐isolation with superabsorbent polymer and SEC (Sepharose CL‐2B or Sepharose 6B in either 10 or 20 mL columns) using fractions 6–15 and 10–22 for the shorter and longer columns, respectively.
FIGURE 5
FIGURE 5
Analysis of all the fractions from the different size exclusion chromatography (SEC) columns after concentration with SAP (one entire batch of 500 mL culture supernatant with EVs divided equally between the different purification methods; N = 3). (a)–(d) The luciferase signal (blue) and protein concentration (red) for all the fractions after purification using different SEC columns. (a) SEC with Sepharose CL‐2B and 10 mL column. (b) SEC with Sepharose CL‐2B and 20 mL column. (c) SEC with Sepharose 6B and 10 mL column. (d) SEC with Sepharose 6B and 20 mL column.
FIGURE 6
FIGURE 6
Yields and purities for the different methods in the purification step after concentration with superabsorbent polymer (SAP). (a) Yield for the different methods in the purification step compared to the luciferase signal after the concentration step with SAP. (b) Purity for SAP (prior to purification) and the different methods in the purification step demonstrated as a luciferase signal per protein (arbitrary numbers). Analysis by one‐way ANOVA, * p < 0.05, ** p < 0.01, *** p < 0.001, **** p < 0.0001, #p < 0.005, N = 3. (c)–(h) Transmission electron microscopy analysis of extracellular vesicles (EVs) concentrated with SAP and purified using the different methods in the purification step (scale bars = 500 nm; N = 2). (c) EVs concentrated with SAP and prior to purification. (d) EVs isolated with size exclusion chromatography (SEC) using Sepharose CL‐2B, with a 10 mL column. (e) EVs isolated with SEC using Sepharose CL‐2B, with a 20 mL column. (f) EVs isolated with SEC using Sepharose 6B, with a 10 mL column. (g) EVs isolated with SEC using Sepharose 6B, with a 20 mL column. (h) EVs isolated using iodixanol density cushion (IDC).
FIGURE 7
FIGURE 7
Analysis of extracellular vesicles (EVs) isolated using non‐ultracentrifugation‐based and ultracentrifugation‐based methods using nano‐FCM and transmission electron microscopy (TEM) as well as the total yield and purity of the methods. (a) Nano‐FCM analysis showing expression of CD63, CD81 and CD9 on EVs concentrated with ultracentrifugation (UC) or superabsorbent polymer (SAP) using 3 biological replicates. Analysis by two‐way ANOVA, * p < 0.05, ** p < 0.01. (b)–(e) TEM analysis of EVs isolated using ultracentrifugation (UC; b) and UC together with iodixanol density cushion (UC + IDC; c), superabsorbent polymer (SAP; d), and SAP together with size exclusion chromatography Sepharose CL‐2B, 10 mL (SAP + SEC; e). N = 2, scale bars = 2 µm (left panel) and 200 nm (right panel). (f) Total yield for the entire workflow using UC‐based (UC + IDC) or the best non‐UC‐based (SAP + 2B‐10 SEC) methods, both for the concentration and purification steps. (g) Total purity for the entire workflow using UC‐based or non‐UC‐based methods, both for the concentration and purification steps. Analysis by paired t‐test, * p < 0.05, N = 3. ns, non‐significant.
FIGURE 8
FIGURE 8
Effects of EVs in an in vitro wound healing assay comparing EVs isolated using ultracentrifugation‐based and non‐ultracentrifugation‐based methods. (a)–(f). Pictures show the closing of the induced wound after treatment with EVs isolated using ultracentrifugation (UC; a), UC together with iodixanol density cushion (UC + IDC; b), superabsorbent polymer (SAP; c) and SAP together with size exclusion chromatography (SAP + SEC; d), or treatment with heat inactivated EVs (e) and no treatment (f). N = 3, shown is one of the replicates. (g) The closing of the cells after EV‐treatment is shown as a percentage of closing compared to no treatment. Analysis by one‐way ANOVA. **** p < 0.0001 compared with heat inactivated EVs, N = 3. ns, non‐significant.

Similar articles

References

    1. Bano, R. , Ahmad F., and Mohsin M.. 2021. “A Perspective on the Isolation and Characterization of Extracellular Vesicles From Different Biofluids.” RSC Advances 11, no. 32: 19598–19615. - PMC - PubMed
    1. Chen, J. , Li P., Zhang T., et al. 2022. “Review on Strategies and Technologies for Exosome Isolation and Purification.” Frontiers in Bioengineering and Biotechnology 9, 811971. - PMC - PubMed
    1. Corso, G. , Heusermann W., Trojer D., et al. 2019. “Systematic Characterization of Extracellular Vesicle Sorting Domains and Quantification at the Single Molecule—Single Vesicle Level by Fluorescence Correlation Spectroscopy and Single Particle Imaging.” Journal of Extracellular Vesicles 8, no. 1: 1663043. - PMC - PubMed
    1. Crescitelli, R. , Lässer C., Jang S. C., et al. 2020. “Subpopulations of Extracellular Vesicles From Human Metastatic Melanoma Tissue Identified by Quantitative Proteomics After Optimized Isolation.” Journal of Extracellular Vesicles 9, no. 1: 1722433. - PMC - PubMed
    1. Crescitelli, R. , Lässer C., and Lötvall J.. 2021. “Isolation and Characterization of Extracellular Vesicle Subpopulations From Tissues.” Nature Protocols 16, no. 3: 1548–1580. - PubMed

LinkOut - more resources