. 2025 Feb;12(8):e2412503.
doi: 10.1002/advs.202412503. Epub 2025 Jan 22.

Attractor Landscape Analysis Reveals a Reversion Switch in the Transition of Colorectal Tumorigenesis

Affiliations

Attractor Landscape Analysis Reveals a Reversion Switch in the Transition of Colorectal Tumorigenesis

Dongkwan Shin et al. Adv Sci (Weinh). 2025 Feb.

Abstract

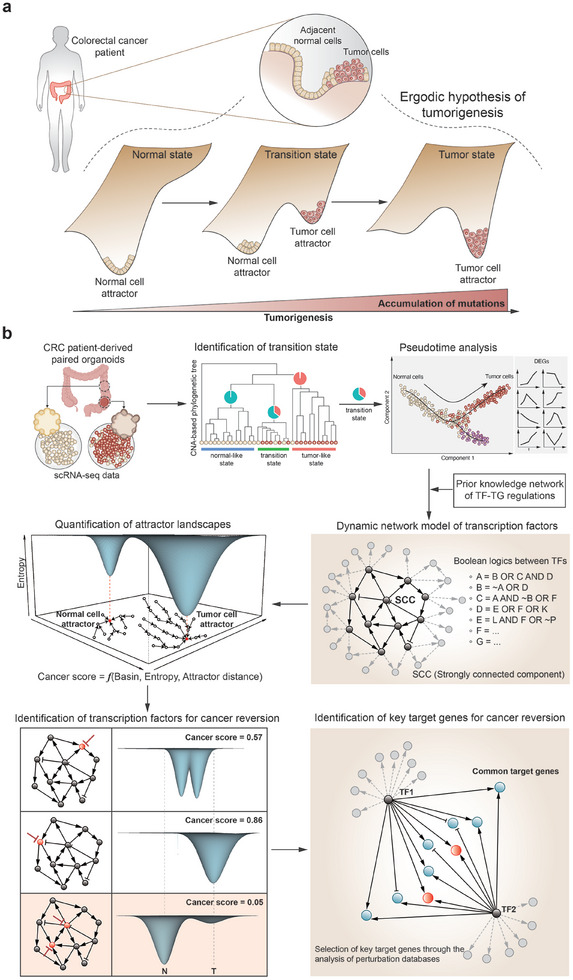
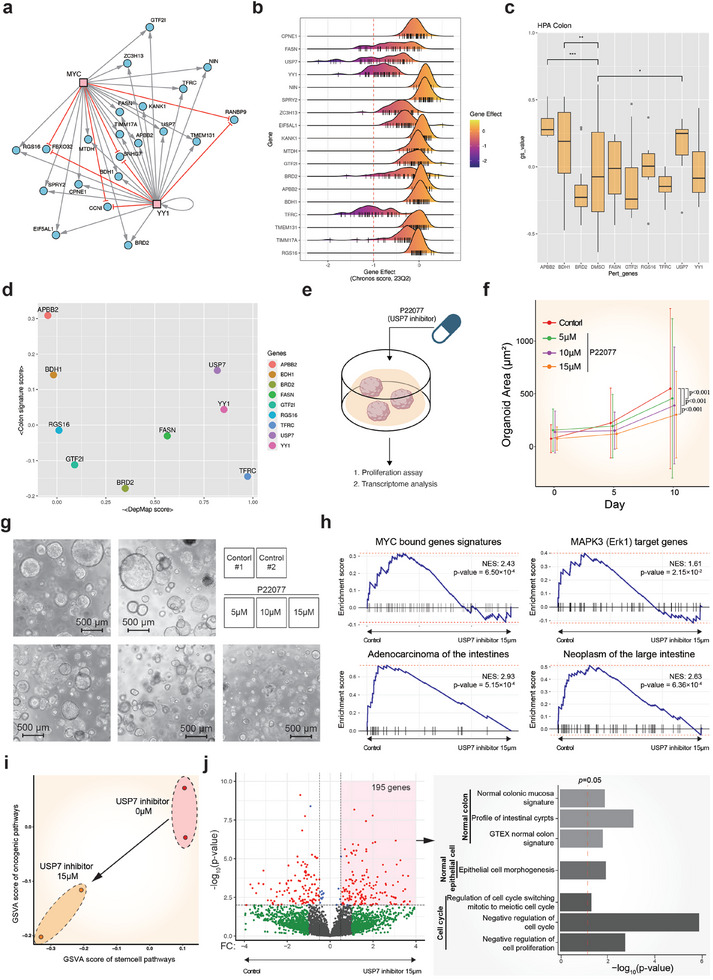
A cell fate change such as tumorigenesis incurs critical transition. It remains a longstanding challenge whether the underlying mechanism can be unraveled and a molecular switch that can reverse such transition is found. Here a systems framework, REVERT, is presented with which can reconstruct the core molecular regulatory network model and a reversion switch based on single-cell transcriptome data over the transition process is identified. The usefulness of REVERT is demonstrated by applying it to single-cell transcriptome of patient-derived matched organoids of colon cancer and normal colon. REVERT is a generic framework that can be applied to investigate various cell fate transition phenomena.

Keywords: attractor landscape analysis; cancer reversion; colon cancer; critical transition; dynamic network model; patient‐derived organoid; single cell transcriptome data.


Conflict of interest statement

The authors declare no conflict of interest.

Figures

Figure 1
Figure 1
Conceptual framework of tumor transition state and overview of REVERT. a) Conceptual framework of tumor transition state. The ergodic hypothesis in statistical physics suggests that a snapshot of a cell population taken from a cancer patient would capture the entire process of tumorigenesis. This includes the normal state with a stable normal cell attractor in an epigenetic landscape, the intermediate transition state in which the normal cell attractor destabilizes while a tumor cell attractor emerges and stabilizes, and the eventual tumor state where the tumor cell attractor dominates. b) Workflow of REVERT.
Figure 2
Figure 2
Identification of tumor transition state. a) Principal component analysis of scRNA‐seq data of cancer and adjacent normal tissues in transcriptomic (left column) or CNV (right column) spaces. Cells are colored by their originated tissues (top), their aneuploidy (middle), and their cell state (bottom). b) Phylogenetic tree reconstructed from single‐cell CNV profiles. It was inferred by the neighbor joining method and colored by cell origin, aneuploidy, and predicted state. c) Cell composition of normal and cancer tissues (left) and the transition state (right) in terms of aneuploidy. d) Critical transition index and single‐cell entropy (scEntropy) for normal‐like, transition, and cancer‐like states. e) Gene set scoring of cancer‐related signatures (top) and normal colorectal tissue signatures (bottom).
Figure 3
Figure 3
Reconstruction of dynamic network model for the transition state of colorectal cancer. a) Schematic overview of reconstructing a dynamic GRN model for the tumor transition state. Binarized single‐cell gene expression data and prior knowledge of the GRN structure are integrated to infer Boolean logic rules. b) Pseudotime trajectory of the tumor transition state inferred by Monocle. A specific trajectory was selected as the path from normal to cancer origin cells. c) Network structure of strongly connected components (SCCs) extracted from the GRN. Red links indicate inhibitory regulations, whereas black links represent activating regulations. d) State transition diagram and the molecular profiles of the attractors in the inferred Boolean network model. Attractors were sorted according to their basin size. We considered only 1000 random initial states and obtained a total of nine attractors, including eight point attractors and one cyclic attractor. The cyclic attractor is not shown in the figure as its corresponding basin size is the smallest. e. Attractors for each single‐cell state as an initial state. Cells in the earliest or latest pseudotime converge to Attractor 5 (normal attractor) and Attractor 1 (cancer attractor), respectively.
Figure 4
Figure 4
Quantification of the attractor landscape to identify optimal therapeutic targets for cancer reversion. a) Workflow for quantifying the attractor landscape to obtain the cancer score. The discrete attractor landscape is transformed into continuous landscape in n‐c axis by introducing effective distance (projection onto the n‐c axis), attractor entropy (depth of valleys), and basin size (width of valleys) for each attractor. The cancer score quantifies the malignancy of the landscape by calculating the volume of valleys, scaled by their proximity to the cancer attractor. b) Mapping of single cells from the transition state onto the attractor landscape, showing effective distance (left) and attractor entropy (center) along pseudotime. Scattering cells onto an effective distance‐attractor entropy plane enables a rough visualization of the landscape (right). c) Basin size (left) and attractor entropy (right) of attractors for 10000 random initial states. The effective distances of five attractors are represented on the y‐axis, and the effective distances of initial states are on the x‐axis. The histogram on the y‐axis indicates the basin size of the five attractors. d) 2D representation of the attractor landscape for the transition state. The relative positions, depths and widths of the valleys were determined by the effective distance, attractor entropy, and basin size obtained in (c). N and C represent the normal cell and cancer cell attractors, respectively. e,f) In silico perturbation analysis of gene expression, showing changes in basin size (e) and cancer score (f) in response to gene knockout or overexpression. The cancer score of the control without any perturbation in colored in blue, whereas the five most effective cases are colored in orange. “0” and “1” indicate knockout and overexpression of the corresponding gene, respectively. g) Changes in the attractor landscape for the knockout of YY1 (top) and the double knockout of YY1 and MYC (bottom). h) Cancer scores for double knockout among the top five effective perturbations in (f). i) Summary of the most effective double‐node perturbations for various hyperparameter sets.
Figure 5
Figure 5
Experimental validation of the optimal target gene for cancer reversion. a) Common target genes positively (gray lines) or negatively (red lines) regulated by both MYC and YY1 transcription factors. b) Cancer dependency scores of positively regulated common target genes derived from CRISPR knockout screen datasets (DepMap) across various colon cancer cell lines. Negative scores indicate cell growth inhibition upon gene knockout. Bars in the x‐axis represent given cell lines. c) Enrichment analysis of gene expression changes following genetic perturbation of colon cancer cell lines (HT29, LOVO, SW480, SW620, and HCT116) using the LINCS L1000 database. The normal colon gene signature was obtained from the Human Protein Atlas. d) Identification of USP7 as the optimal target gene for cancer reversion, based on combined scores for cancer dependency and normal signature enrichment. e) Schematic representation of the experimental methodology using the USP7 inhibitor P22077 to validate USP7 as a potential target for cancer reversion in colon cancer organoids. f) Quantification of the colon cancer organoids growth changes upon USP7 knockdown, depicting the relative growth rates at day 0, 5, and 10 post‐knockdown for varying concentrations of the USP7 inhibitor (0 × 10−6, 5 × 10⁻⁶, 10 × 10−6, and 15 × 10−6 m). The p‐value was calculated using repeated‐measures (RM) analysis of variance (ANOVA): p < 0.001. g) Representative images depicting the morphological changes and reduced growth of colon cancer organoids upon USP7 knockdown using the inhibitor P22077, compared to untreated control organoids. h) Gene set enrichment analysis (GSEA) results illustrating the significant downregulation of gene signatures associated with tumor formation upon USP7 knockdown in colon cancer organoids. i) Dot plot representation depicting the GSVA scores for stem cell pathways (x‐axis) versus oncogenic pathways (y‐axis) in USP7 knockdown organoids (orange dots) and control organoids (red dots). j) (Left) Volcano plot illustrating the differentially expressed genes between control organoids and USP7 knockdown organoids, with genes exhibiting significant upregulation upon USP7 inhibition highlighted in red. (Right) Bar plot depicting the results of GO analysis for the 195 positively differentially expressed genes.

Similar articles

Cited by

References

    1. a) Mojtahedi M., Skupin A., Zhou J., Castano I. G., Leong‐Quong R. Y., Chang H., Trachana K., Giuliani A., Huang S., PLoS Biol. 2016, 14, e2000640; - PMC - PubMed
    2. b) Poovathingal S. K., Kravchenko‐Balasha N., Shin Y. S., Levine R. D., Heath J. R., Small 2016, 12, 1425; - PMC - PubMed
    3. c) Zhong J., Han C., Chen P., Liu R., Brief Bioinform. 2023, 24, bbad366; - PubMed
    4. d) Gan Y., Guo C., Guo W., Xu G., Zou G., Brief Bioinform. 2022, 23, bbac225; - PubMed
    5. e) Sha Y., Wang S., Zhou P., Nie Q., Nucleic Acids Res. 2020, 48, 9505; - PMC - PubMed
    6. f) Giuliani A., Tsuchiya M., Yoshikawa K., Entropy 2017, 20, 13. - PMC - PubMed
    1. Shin D., Lee J., Gong J. R., Cho K. H., Nat. Commun. 2017, 8, 1270. - PMC - PubMed
    1. Askanazy M., Verhandlungen der Deutschen Pathologischen Gesellschaft 1907, 11, 44.
    1. a) Telerman A., Amson R., Nat. Rev. Cancer 2009, 9, 206; - PubMed
    2. b) Lo‐Coco F., Avvisati G., Vignetti M., Thiede C., Orlando S. M., Iacobelli S., Ferrara F., Fazi P., Cicconi L., Di Bona E., Specchia G., Sica S., Divona M., Levis A., Fiedler W., Cerqui E., Breccia M., Fioritoni G., Salih H. R., Cazzola M., Melillo L., Carella A. M., Brandts C. H., Morra E., von Lilienfeld‐Toal M., Hertenstein B., Wattad M., Lubbert M., Hanel M., Schmitz N., et al., d. A. Gruppo Italiano Malattie Ematologiche, G. German‐Austrian Acute Myeloid Leukemia Study, L. Study Alliance , N. Engl. J. Med. 2013, 369, 111; - PubMed
    3. c) Dow L. E., O'Rourke K. P., Simon J., Tschaharganeh D. F., van Es J. H., Clevers H., Lowe S. W., Cell 2015, 161, 1539; - PMC - PubMed
    4. d) Lee S., Lee C., Hwang C. Y., Kim D., Han Y., Hong S. N., Kim S. H., Cho K. H., Mol. Cancer Res. 2020, 18, 118; - PubMed
    5. e) Shin D., Cho K. H., Exp. Mol. Med. 2023, 55, 692. - PMC - PubMed
    1. Choi S. R., Hwang C. Y., Lee J., Cho K. H., Cancer Res. 2022, 82, 320. - PubMed

MeSH terms

LinkOut - more resources