. 2025 Apr 3;145(14):1568-1582.
doi: 10.1182/blood.2024024901.

Aging platelets shift their hemostatic properties to inflammatory functions

Affiliations

Aging platelets shift their hemostatic properties to inflammatory functions

Afra Anjum et al. Blood. .

Abstract

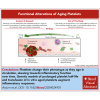
Platelets are crucial players in hemostasis and thrombosis but also contribute to immune regulation and host defense, using different receptors, signaling pathways, and effector functions, respectively. Whether distinct subsets of platelets specialize in these diverse tasks is insufficiently understood. Here, we used a pulse-labeling method in Mus musculus models for tracking in vivo platelet aging and its functional implications. Using in vitro and in vivo assays, we reveal that young, reticulated platelets show heightened responses in the setting of clot formation, with corresponding, increased responses to agonists, adhesion, and retractile function. Unexpectedly, aged platelets lose their hemostatic proficiency but are more prone to react to inflammatory challenge: compared with reticulated platelets, this cohort was more likely to form platelet-leukocyte aggregates and showed increased adhesion to neutrophils in vitro, as well as enhanced bactericidal function. In vivo, this was reflected in increased pulmonary recruitment of aged platelets in an acute lung injury model. Proteomic analyses confirmed the upregulation of immune pathways in this cohort, including enhanced procoagulant function. In mouse models of prolonged platelet half-life, this resulted in increased pulmonary leukocyte infiltration and inflammation upon acute lung injury. Similarly, human platelet concentrates decreased their hemostatic function and elevated their putative immunomodulatory potential in vitro over time, and in a mouse model of platelet transfusion, aged platelet concentrates resulted in augmented inflammation. In summary, we show that platelets exhibit age-dependent phenotypic shifts, allowing them to fulfill their diverse tasks in the vasculature. Because functional alterations of aging platelets extend to platelet concentrates, this may hold important implications for transfusion medicine.


Conflict of interest statement

Conflict-of-interest disclosure: The authors declare no competing financial interests.

Figures
None
Graphical abstract
Figure 1.
Figure 1.
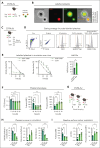
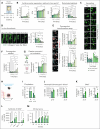
Tracking of platelet age cohorts in vivo. (A) Pulse-labeling scheme in C57BL/6J mice. (B) Representative image of isolated platelets from pulse-labeled mice spread on a fibrinogen-coated chamber. (C) Experimental outline depicting C57BL/6J mice pulse-labeled with X488 and X649 antibodies at 12-hour interval with repetitive blood sampling over time. (D) Representative gating strategy for flow cytometric analysis of pulse-labeled platelets in whole blood. (E) Graph showing percentage of labeled platelets (of all CD41+ platelets) over time, with 2-way repeated measures (RM) analysis of variance (ANOVA), comparison between labeled platelet groups (P = .0008), with the post hoc Šídák multiple comparisons test; bar graph depicting half-life of labeled platelets; paired t test, 2-tailed (P = .0021; n = 5). (F) Single-labeled platelet size; RM 1-way ANOVA (P < .0001); P-selectin expression over time in single-labeled platelets (RM 1-way ANOVA; P = .0289); phosphatidylserine exposure (RM 1-way ANOVA, P = .0178), with the post hoc Dunnett multiple comparisons test. (G) Scheme for pulse-labeling mice 108, 60, and 12 hours before sampling to determine platelet phenotype in different age cohorts simultaneously. (H) Graphs depicting single-labeled platelet percentage in circulation (n = 4 per group), platelet clearance rate (n = 5 per group), and platelet half-life (n = 4 per group); ordinary 1-way ANOVA for each graph, P < .0001; the post hoc Dunnett multiple comparisons test compared with the 0- to 12-hour group. (I) Platelet surface markers of single-labeled platelets: P-selectin mean fluorescence intensity (MFI; n = 4 per group), desialylation (RCA I binding MFI) relative to MFI of all platelets (n = 5 per group), and phosphatidylserine exposure measured by C1q binding (n = 4 per group); ordinary 1-way ANOVA, P = .0385, .0004, and .0063, respectively; the post hoc Dunnett multiple comparisons test compared with the 0- to 12-hour group. ∗P < .05; ∗∗P < .01; ∗∗∗P < .001; ∗∗∗∗P < .0001; FSC-A, forward scatter; h, hours; ns, nonsignificant.; rel.RCA I, relative Ricinus Communis Agglutinin I binding; SSC-A, sideward scatter.
Figure 2.
Figure 2.
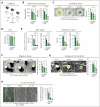
Aged platelets display diminished hemostatic and thrombotic potential in vitro. (A) Schematic outline showing pulse-labeled C57BL/6J mice (red arrow, X649; green arrow, X488). (B) MitoTracker and tetramethylrhodamine MFI of platelet age cohorts analyzed via flow cytometry (n = 4 per group; both P < .0001). (C) Representative micrographs of spread platelets and analysis of platelet size by area (n = 3 per group; P = .0060). (D) Platelet size measured by FSC-A (n = 4 per group; P = .0085). (E) Flow cytometric measurements of P-selectin expression (MFI) and GPIIbIIIa (αIIbβ3) integrin activation (MFI) in washed platelets after treatment with agonists relative to their expression after phosphate-buffered saline (PBS) treatment (n = 4 per group; all P < .0001). (F) Representative images of single-labeled platelet migration on labeled fibrinogen substrate and quantification of migration as cleared area (n = 4 per group; P = .0094); outlined area showing cleared substrate. (G) Representative micrographs showing single-cell clot retraction assay of pulse-labeled platelets with fibrinogen and platelet poor plasma (n = 3 per group; P = .0406); outlined area showing retracted substrate. (H) Representative micrographs of single-labeled platelets (using Image Calculator in ImageJ: subtracting X649 labeled from X488) showing in vitro thrombus formation with whole blood on collagen I (n = 3 per group); white dotted lines enclose area depicting thrombi; bar graph depicting percentage of single-labeled platelets in thrombus relative to the percentage of single-labeled platelets in blood (P = .0005). Statistical tests for all, ordinary 1-way ANOVA with the post hoc Dunnett multiple comparisons test compared with 0- to 12-hour group. ∗P < .05; ∗∗P < .01; ∗∗∗P < .001; ∗∗∗∗P < .0001; h, hour; ns, nonsignificant.
Figure 3.
Figure 3.
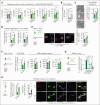
Aged platelets show increased thromboinflammatory potential in vitro. (A) Bar graphs representing flow cytometric analysis of baseline surface markers of platelet age cohorts in whole blood (n = 4 per group; P = .0106, .0291, .0484, .0216, .0047, and .0216, respectively). (B) Bar graph depicting the percentage of single-labeled platelets that are PS+P-selectin–positive (P = .0023). (C) Representative micrographs and quantification of procoagulant activation of single-labeled platelets seeded on collagen I/fibrinogen matrix (n = 3 per group); graph showing percentage of single-labeled procoagulant platelets (P = .0145). (D) Bar graphs showing PLA (percentage of single-labeled platelets aggregating with leukocytes; P < .0001) and PNA (percentage of single-labeled platelets aggregating with neutrophils; P = .0318) in mouse whole blood (n = 4 per group). (E) Schematic outline, representative micrographs, and quantification of isolated platelets from pulse-labeled mice coincubated with isolated neutrophils (n = 3 per group); bar graph representing percentage of single-labeled platelets of total platelets aggregating with neutrophils (P = .0038). (F) Schematic outline of isolated platelet-rich plasma from pulse-labeled C57BL/6J mice coincubated (n = 4 per group) with isolated neutrophils (nonlabeled C57BL/6J mice, n = 2); bar graph representing the percentage of single-labeled platelets out of total platelets aggregating with neutrophils relative to their percentage in circulation (P = .0322); bar graphs depicting surface marker expressions in neutrophils post aggregation with pulse-labeled platelets: CD11b (P = .0030), CD66a (P = .0054), CD177 (P = .0143); statistical tests, unpaired t tests, 2-tailed. (G) Platelets isolated from mice pulse-labeled 108 hours before experiment treated with anti-GPIb, anti-GPIIbIIIa, anti-PSGL, and anti-CD40 Fab fragments/antibodies coincubated with isolated neutrophils; quantification of single-labeled platelets aggregating with neutrophils relative to control depicted in a bar graph (P < .0001). Statistical tests for panels A-E and 3G, ordinary 1-way ANOVA with the post hoc Dunnett multiple comparisons test. (H) Schematic outline shows pulse-labeled platelets coincubated with methicillin-susceptible S aureus prestained with SYTO 41 dye (5 μM), followed by staining with Live-or-Dye NucFix of killed bacteria; bar graphs depicting percentage of pulse-labeled platelets aggregating to methicillin-susceptible S aureus (MSSA) relative to their percentage in circulation (<0.0001) and the percentage of dead bacteria represented by the percentage of MSSA that are positive for NucFix (0.0408); statistical tests, unpaired t tests, 2-tailed. ∗P < .05; ∗∗P < .01; ∗∗∗P < .001; ∗∗∗∗P < .0001. h, hour; ns, nonsignificant.
Figure 4.
Figure 4.
Recruitment of specialized age subsets in thrombosis and inflammation in vivo. (A-C) C57BL/6J mice (n = 3 per group) were pulse labeled 108 hours and 12 hours before blood sampling and mesentery vein imaging; experimental outline (A); percentage of single-labeled platelets in circulation (B; unpaired t test, 2-tailed P = .0492); Representative micrographs depicting thrombi initiated by exposing mesentery vein to FeCl3 (C); bar graphs depicting the percentage of area covered in thrombus by single-labeled platelets relative to platelet percentage in circulation in panel B (unpaired t test, 2-tailed, P = .0097). (D-H) Pulse-labeled C57BL/6J mice (E-G; n = 4 per group) were subjected to acute lung injury; experimental outline (D); percentage decline of single-labeled platelets in circulation (E; 2-way RM ANOVA, comparison between labeled platelet groups: P = .0022, with the post-hoc Dunnett multiple comparisons test); PLA formation in circulation 8 hour after acute lung injury (ALI) and in BALF (F; both P < .0001); percentage of single-labeled platelets recruited in BALF relative to the percentage in circulation 8 hour after ALI (G; P = .0002); C57BL/6J mice (n = 3 per group) were euthanized 8 hour after acute lung injury (H); lung histology was performed via staining with CD41; percentage of single-labeled platelets recruitment depicted in the bar graph (P = .0072); For panels F-H, the reported P values are from ANOVA summary; statistical tests, ordinary 1-way ANOVA with the post-hoc Dunnett multiple comparisons test compared with the 0- to 12-hour group. ∗P < .05; ∗∗P < .01; ∗∗∗P < .001; ∗∗∗∗P < .0001; h, hours; ns, nonsignificant.
Figure 5.
Figure 5.
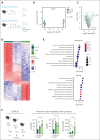
Platelet aging proteomics. (A-E) Rosa26-DTRxPF4cre mice were administered with DT, intraperitoneally every 48 hours; mixed-aged platelet cohorts were isolated from Cre mice 4 days after serial DT injections (n = 4); platelets aged >4 days were collected 4 days after serial DT injections in Cre+ mice (n = 4); platelets aged <1 day were collected 8 days after serial DT injections in Cre+ mice during platelet recovery phase (n = 4); schematic outline (A); principal component analysis of all 2062 proteins quantified (n = 4) (B); volcano plot (C) of a student t test (P < .05; |log2 fold change| > 2) comparing 3124 proteins in the young (left) and old (right) cohorts; heat map (D) of the 447 significant proteins from panel C; Fisher exact test enrichment analysis (false discovery rate <0.02; count ≥10, top 10) of gene ontology biological pathway terms (E) among differential proteins from panel C. (F) Proteomic findings were confirmed by analyzing surface marker expression of single-labeled platelets in pulse-labeled C57BL/6J mice (n = 4 per group) via whole blood flow cytometry; CD36 (P = .0009), C3 (P = .0013) and fibrinogen (P = .0035); statistical tests, ordinary 1-way ANOVA with the post hoc Dunnett multiple comparisons test compared with the 0- to 12-hour group. ∗∗P < .01; ∗∗∗P < .001; FC, fold change; h, hour; LFQ, label-free quantification; ns, nonsignificant; rRNA, ribosomal RNA.
Figure 6.
Figure 6.
Increased platelet half-life fosters inflammation. (A) Schematic outline showing blood sampling from WT and BAK/BAXplt–/– DKO. (B) Gating strategy for procoagulant platelets. (C) Bar graphs depicting flow cytometric analysis of percentage (%) of procoagulant platelets (P = .0121), P-selectin–positive platelet percentage (0.4077), PS+ platelet percentage (0.0092), and platelet size forward scatter area (0.0915). (D) Gating strategy for PNA in whole blood; bar graph shows the percentage of CD41+ aggregated to Ly-6G+ cells (P = .0031). Statistical tests for panels A-D, unpaired t tests, 2-tailed. (E) Experimental outline of acute lung injury in WT (n = 10), BAK KO (n = 8), BAXplt–/– (n = 10), BAK BAXplt–/– KO (n = 9), and rejuvenated BAK BAXplt–/– KO (n = 4) after antibody-mediated platelet depletion. (F) Bar graphs showing flow cytometric analysis of PNA (P = .0010). (G) RBC count (P = .0017) and neutrophil counts (P = .0009) in BALF. For panels F-G, ordinary 1-way ANOVA with post hoc Dunnett multiple comparisons test compared with WT. (H) Assessment of cytokine measurements in BALF, 2-way ANOVA comparison between mouse strains (P < .0001), with the post hoc Dunnett multiple comparisons test compared with WT. ∗P < .05; ∗∗P < .01; ∗∗∗P < .001; ∗∗∗∗P < .0001; FSC-A; h, hour; IL, interleukin; LPS i.n., lipopolysaccaride intranasally; ns, nonsignificant; SSC-A, sideward scatter; TNF-α, tumor necrosis factor α.
Figure 7.
Figure 7.
Platelets shift toward inflammatory function during in vitro storage. (A) Schematic outline of platelet concentrate sampling scheme. (B) Flow cytometric analysis of baseline surface marker expression PS exposure (0.0170), CD36 (0.0028), and CD47 (0.0045) relative to time point 1 [TP1]; percentage of reticulated platelets depicted by thiazole orange positive cells (n = 3; P < .0001; RM 1-way ANOVA with the post hoc Dunnett multiple comparisons test compared with TP1). (C) Representative micrographs and analysis of spreading of unactivated or stimulated (4-μM adenosine 5′-diphosphate [ADP] + 2-μM U46619) platelets (n = 3); 2-way RM ANOVA (comparison between PBS and ADP, P = .0064) with post hoc Holm-Šídák multiple comparisons test compared with TP1. (D) Representative micrographs showing in vitro thrombus formation (n = 5); bar graph showing the percentage of thrombus area per field of view (P = .0058). (E) Representative micrographs of procoagulant activation of platelets seeded on collagen I/fibrinogen matrix; graphs showing percentage of procoagulant platelets (P = .0107) and percentage of ballooned procoagulant platelets relative to TP1 (P = .001). (F) Flow cytometric analysis showing percentage of P-selectin–positive PS+ platelets (n = 4; P = .0105). (G) Schematic outline of platelet-neutrophil coincubation (n = 3); flow cytometric analysis showing percentage of platelets aggregating with neutrophils (0.0274); statistical tests for panels D-G, RM 1-way ANOVA with the post hoc Dunnett multiple comparisons test compared with TP7. (H) In vitro aged donor C57BL/6J platelets, freshly isolated (day 0 [D0], n = 4) or stored for 2 days in DSD (day 2 [D2], n = 7) were transfused into thrombocytopenic C57BL/6J recipient mice (n = 4 per group); LPS was given intranasally to induce acute lung injury (ALI) in recipients; blood sampled at 0 and 6 hours after ALI and BALF was collected. (I) Bar graph depicting decline of transfused platelets, mixed-effects model (REML), and comparison between transfused groups (P = .0015 with the post hoc Šídák multiple comparisons test). (J) Bar graphs showing surface marker expression: CD11b (P = .0344) and CD66a (P = .0316) of neutrophils in circulation after ALI (unpaired t test, 2-tailed). (K) Bar graphs depicting the percentage of transfused in vitro aged platelets aggregating with CD45+ cells (P = .0203) and the percentage of platelets aggregating with Ly-6G+ cells (P = .0890) in BALF (unpaired t test, 2-tailed). (L) Assessment of cytokine measurements in BALF (2-way ANOVA, comparison between transfused groups; P = .0014, with the post hoc Šídák multiple comparisons test; additional cytokines shown in supplemental Figure 11H. (M) Clinical progression of ALI in recipients that received transfusion with D0 or D2 in vitro–aged platelets (2-way RM ANOVA, comparison between transfused groups; P < .0001, with the post hoc Šídák multiple comparisons test). ∗P < .05; ∗∗P < .01; ∗∗∗P < .001; ∗∗∗∗P < .0001; h, hour; IL, interleukin; LPS I.N., lipopolysaccharide intranasally; ns, nonsignificant; TNF-α, tumor necrosis factor α.

Comment in

References

    1. Nicolai L, Massberg S. Platelets as key players in inflammation and infection. Curr Opin Hematol. 2020;27(1):34–40. - PubMed
    1. Stark K, Massberg S. Interplay between inflammation and thrombosis in cardiovascular pathology. Nat Rev Cardiol. 2021;18(9):666–682. - PMC - PubMed
    1. Guidotti LG, Inverso D, Sironi L, et al. Immunosurveillance of the liver by intravascular effector CD8+ T cells. Cell. 2015;161(3):486–500. - PMC - PubMed
    1. Kaiser R, Escaig R, Nicolai L. Hemostasis without clot formation–how platelets guard the vasculature in inflammation, infection, and malignancy. Blood. 2023;142(17):1413–1425. - PubMed
    1. Nicolai L, Schiefelbein K, Lipsky S, et al. Vascular surveillance by haptotactic blood platelets in inflammation and infection. Nat Commun. 2020;11(1):5778. - PMC - PubMed

LinkOut - more resources