. 2025 Apr 15;85(8):1368-1389.
doi: 10.1158/0008-5472.CAN-24-2330.

SMAD4 and KRAS Status Shapes Cancer Cell-Stromal Cross-Talk and Therapeutic Response in Pancreatic Cancer

Affiliations

SMAD4 and KRAS Status Shapes Cancer Cell-Stromal Cross-Talk and Therapeutic Response in Pancreatic Cancer

Eloise G Lloyd et al. Cancer Res. .

Abstract

Pancreatic ductal adenocarcinoma (PDAC) contains an extensive stroma that modulates response to therapy, contributing to the dismal prognosis associated with this cancer. Evidence suggests that PDAC stromal composition is shaped by mutations within malignant cells, but most previous work has focused on preclinical models driven by KrasG12D and mutant Trp53. Elucidation of the contribution of additional known oncogenic drivers, including KrasG12V mutation and Smad4 loss, is needed to increase the understanding of malignant cell-stromal cell cross-talk in PDAC. In this study, we used single-cell RNA sequencing to analyze the cellular landscape of Trp53-mutant mouse models driven by KrasG12D or KrasG12V, in which Smad4 was wild type or deleted. KrasG12DSmad4-deleted PDAC developed a fibro-inflammatory rich stroma with increased malignant JAK/STAT cell signaling and enhanced therapeutic response to JAK/STAT inhibition. SMAD4 loss in KrasG12V PDAC differently altered the tumor microenvironment compared with KrasG12D PDAC, and the malignant compartment lacked JAK/STAT signaling dependency. Thus, malignant cell genotype affects cancer cell and stromal cell phenotypes in PDAC, directly affecting therapeutic efficacy. Significance: SMAD4 loss differentially impacts malignant cell-stromal cell signaling and treatment sensitivity of pancreatic tumors driven by KRASG12D or KRASG12V, highlighting the importance of understanding genotype-phenotype relationships for precision therapy.


Conflict of interest statement

Conflict of interest disclosure statement

The authors declare no potential conflicts of interest.

Figures

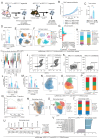
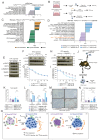
Figure 1
Figure 1. SMAD4-deficient human organoid-derived PDAC tumors have less fibrosis than SMAD4 WT tumors.
(A) Schematic of analyses of orthotopically-grafted human organoid-derived pancreatic ductal adenocarcinoma (PDAC) models in NOD SCID gamma (NSG) mice. U/S, ultrasound-based imaging. (B-C) Volumes, measured by U/S, of tumors derived from the transplantation of KP (58 days post-transplant) (B) or KvP (64 days post-transplant) (C) SMAD4 wild-type (WT) or SMAD4-deficient human PDAC organoids with KRASG12D or KRASG12V mutation, respectively. (D) Representative SMAD4, Masson’s trichrome and alpha smooth muscle actin (αSMA) stains in SMAD4 WT or SMAD4-deficient human organoid-derived KP PDAC. Scale bars, 50 μm. (E-F) Quantification of Masson’s trichrome (E) and αSMA (F) stains in SMAD4 WT or SMAD4-deficient human organoid-derived PDAC. For C, E and F, results show mean ± SEM. *, P < 0.05, **, P < 0.01; ***, P < 0.001, Mann-Whitney test.
Figure 2
Figure 2. Smad4 loss impacts the immune TME in KPC PDAC.
(A) Schematic of analyses of KPC (i.e. KrasG12D p53-mutant) orthotopically-grafted organoid-derived PDAC models in nu/nu (left) or C57BL/6J (right) mice. (B) Proliferation curves of KPCSmad4-WT or KPCSmad4-KO (KO3 and KO4) PDAC organoids cultured for 120 hours in reduced media (i.e., 5% FBS DMEM). Data were normalized to the first measurement (3 hours post-plating). Results show mean ± SEM of n=2 biological replicates (with n=4 technical replicates each). ***, P < 0.001, Mann-Whitney test calculated for the last time point. (C) Volumes of tumors derived from transplantation of KPCSmad4-WT or KPCSmad4-KO organoids in C57BL/6J mice measured by U/S. Results show mean ± SEM from 2 separate experiments, each with 1 WT group and 2 groups of KO pools from 2 different guides (32 days (n= 4 WT and n= 8 KO) or 21 days (n= 4 WT and n= 6 KO) post-transplant). ***, P < 0.001, Mann-Whitney test. (D) Volumes of tumors derived from transplantation of KPCSmad4-WT or KPCSmad4-KO PDAC organoids in nu/nu mice measured by U/S. Results show mean ± SEM from 2 separate experiments, each with 1 WT group and 2 groups of KO pools from 2 different guides (25 days (n= 4 WT and n= 7 KO) or day 21 days (n= 4 WT and n= 6 KO) post-transplant). *, P < 0.05, Mann-Whitney test. (E-F) Uniform manifold approximation and projection (UMAP) plot shows cell clusters from KPCSmad4-WT (n=3) or KPCSmad4-KO (n=6) tumors analyzed by single-cell RNA-sequencing (scRNA-seq), color-coded by (E) genotype or (F) cell type. (G) Upregulated and downregulated differentially expressed genes (DEGs) in each cell type identified by pseudobulk analysis from scRNA-seq of KPCSmad4-WT or KPCSmad4-KO tumors. False discovery rate (FDR) < 0.05. (H) Cell type contribution in KPCSmad4-WT or KPCSmad4-KO tumors. (I) Violin plots showing the distribution of groups of nearest neighbor cells from different cell type clusters upon the log-fold change between KPCSmad4-KO vs KPCSmad4-WT conditions computed with Milo. The malignant cell cluster was divided by cells from Smad4 WT or Smad4 KO tumors to clarify the directionality of abundance. (J-K) Representative flow plots of (J) neutrophils (CD45+CD11b+Gr1+) and (K) macrophages (CD45+Gr1-CD11b+F4/80+) from KPCSmad4-WT or KPCSmad4-KO tumors in C57BL/6J mice. (L-M) Flow cytometric analysis of neutrophils (CD45+CD11b+Gr1+) and macrophages (CD45+Gr1-CD11b+F4/80+) from live singlets in KPCSmad4-WT or KPCSmad4-KO tumors in (L) nu/nu or (M) C57BL/6J mice. Results show mean ± SEM from 3 separate experiments, each with 1 WT group and 2 groups of KO pools from 2 different guides. **, P < 0.01; ***, P < 0.001, Mann-Whitney test. (N-O) UMAP plot of neutrophils from KPCSmad4-WT or KPCSmad4-KO tumors analyzed by scRNA-seq, color-coded by (N) genotype or (O) sub-cluster. (P) Sub-cluster contribution in neutrophils of KPCSmad4-WT or KPCSmad4-KO tumors. (Q) Gene set enrichment analysis (GSEA) of T3 neutrophil signature in neutrophils from KPCSmad4-KO PDAC compared to KPCSmad4-WT PDAC. The signature from Ng et al (13) is significantly upregulated. NES, normalized enrichment score. (R-S) UMAP plot of macrophages from KPCSmad4-WT or KPCSmad4-KO tumors analyzed by scRNA-seq, color-coded by (R) genotype or (S) sub-cluster. RTM-TAM, resident-tissue macrophage-like tumor-associated macrophage (TAM); LA-TAM, lipid-associated TAM; Angio-TAM, pro-angiogenic TAM; Inflam-TAM, inflammatory cytokine-enriched TAM; Prolif-TAM, proliferating TAM; IFN-TAM, interferon-primed TAM. Macrophage subtypes are from Ma et al (12). (T) Sub-cluster contribution in macrophages of KPCSmad4-WT or KPCSmad4-KO tumors. (U) Dot plot visualization of scaled average expression of macrophage subtype markers in macrophages from KPCSmad4-WT or KPCSmad4-KO tumors analyzed by scRNA-seq. Color intensity represents expression level and dot size represents the percentage of expressing cells. (V) Selected significantly upregulated (i.e. NES > 1.50 and FDR < 0.25) and downregulated (i.e. NES < -1.50 and FDR < 0.25) pathways identified by GSEA of macrophages from KPCSmad4-KO compared to KPCSmad4-WT tumors, assessed by pseudobulk analysis from the scRNA-seq dataset.
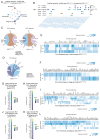
Figure 3
Figure 3. Smad4 loss impacts malignant-stromal crosstalk in KPC PDAC.
(A) Cell-cell communication analysis using CellChat showing the number of connections lost (blue) or gained (red) between malignant cells, fibroblasts, macrophages and neutrophils in KPCSmad4-KO (n=6) compared to KPCSmad4-WT (n=3) tumors, as assessed by scRNA-seq. (B) Selected ligand-receptor interactions and their strength based on CellChat analysis between malignant cells, fibroblasts, macrophages and neutrophils in KPCSmad4-KO tumors compared to KPCSmad4-WT tumors. Commun. Prob., communication probability. (C-D) Selected pathways with significantly different connections between malignant cells, fibroblasts, macrophages, and neutrophils in KPCSmad4-KO tumors compared to KPCSmad4-WT tumors. (E-F) Ligand-target heatmaps show top selected ligands of (E) malignant cells inferred to regulate target genes in macrophages and (F) macrophages inferred to regulate target genes in malignant cells in KPCSmad4-KO PDAC, as assessed by NicheNet analysis of scRNA-seq. (G-H) Ligand activity plots show the top ligands of (G) macrophages or (H) neutrophils inferred to regulate target genes in fibroblasts in KPCSmad4-KO PDAC, as assessed by NicheNet analysis. AUPR, area under the precision-recall curve. (I) Ligand-target heatmap shows top selected ligands of malignant cells inferred to regulate target genes in fibroblasts in KPCSmad4-KO PDAC, as assessed by NicheNet analysis. (J) Ligand activity plot shows the top ligands of malignant cells inferred to regulate target genes in fibroblasts in KPCSmad4-KO PDAC, as assessed by NicheNet analysis. (K) Ligand activity plot shows the top ligands of fibroblasts inferred to regulate target genes in malignant cells in KPCSmad4-KO PDAC, as assessed by NicheNet analysis. (L) Ligand-target heatmap shows top selected ligands of fibroblasts inferred to regulate target genes in malignant cells in KPCSmad4-KO PDAC, as assessed by NicheNet analysis.
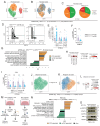
Figure 4
Figure 4. Smad4 loss drives a fibro-inflammatory stroma in KPC PDAC.
(A-B) UMAP plots showing the cell cluster of cancer-associated fibroblasts (CAFs) from KPCSmad4-WT (n=3) or KPCSmad4-KO (n=6) PDAC analyzed by scRNA-seq, color-coded by sub-cluster (A) or genotype (B). (C) Pie charts showing proportions of different CAF clusters from KPCSmad4-WT or KPCSmad4-KO tumors. P < 0.01, chi-square test. (D) Representative flow plots of Ly6C-MHCII- myCAFs, Ly6C+MHCII- iCAFs and Ly6C-MHCII+ apCAFs from KPCSmad4-WT or KPCSmad4-KO tumors in C57BL/6J mice. (E-F) Flow cytometric analyses of (E) myCAFs (Ly6C-MHCII- CAFs), iCAFs (Ly6C+MHCII- CAFs) and apCAFs (Ly6C-MHCII+ CAFs) and (F) myCAF/iCAF ratio from live singlets in KPCSmad4-WT or KPCSmad4-KO tumors in C57BL/6J mice. Results show mean ± SEM from 3 separate experiments, each with 1 WT group and 2 groups of KO pools from 2 different guides. *, P < 0.05, **, P < 0.01, ***, P < 0.001, Mann-Whitney test. (G) Selected significantly upregulated (i.e. NES > 1.50, FDR < 0.25; apart for the IL6 JAK STAT3 signaling HALLMARK with NES=1.47) and downregulated (i.e. NES < -1.50, FDR < 0.25) pathways identified by GSEA of CAFs from KPCSmad4-KO compared to KPCSmad4-WT tumors, as assessed by pseudobulk analysis from scRNA-seq. The in vivo iCAF signature is from Elyada et al (3). (H) Dot plot visualization of the scaled average expression of myCAF-enriched markers in CAFs from KPCSmad4-WT or KPCSmad4-KO tumors, as analyzed by scRNA-seq. Color intensity represents expression level and dot size represents the percentage of expressing cells. (I) Flow cytometric analyses of CD90+, CD49E+, CD56+ and CD105+ CAFs from live singlets in KPCSmad4-WT or KPCSmad4-KO tumors in C57BL/6J mice. Results show mean ± SEM from 3 separate experiments, each with 1 WT group and 2 groups of KO pools from 2 different guides. ***, P < 0.001, Mann-Whitney test. (J-K) UMAP plots showing the malignant cell cluster from KPCSmad4-WT or KPCSmad4-KO tumors analyzed by scRNA-seq (J). Different genotypes are color-coded (K). (L) Dot plot visualization of the scaled average expression of Smad4, Il1a and Il1b in malignant cells from KPCSmad4-WT or KPCSmad4-KO tumors, as analyzed by scRNA-seq. Color intensity represents expression level and dot size represents the percentage of expressing cells. (M) Schematic of flow-sorting strategy of pancreatic stellate cells (PSCs) and KPCSmad4-WT or KPCSmad4-KO PDAC organoids from monocultures or co-cultures for RNA-sequencing (RNA-seq). (N) Selected significantly upregulated and downregulated pathways identified by GSEA of PSCs cultured with KPCSmad4-KO organoids (n=10) compared to PSCs cultured with KPCSmad4-WT organoids (n=5). The in vitro iCAF and myCAF signatures are from Öhlund et al (4). The TGF-β-induced myCAF in vitro signature is from Mucciolo and Araos Henríquez et al (11). The LRRC15+ CAF signature is from Dominguez et al (7). (O) Western blot analysis of phospho-STAT3 (p-STAT3), STAT3 and hypoxia inducible factor 1 alpha (HIF-1α) in PSCs cultured for 4 days in PDAC organoid conditioned media (CM) from KPCSmad4-WT or KPCSmad4-KO organoids. ACTIN, loading controls.
Figure 5
Figure 5. Smad4 loss upregulates IL-1 and JAK/STAT signaling in KPC PDAC.
(A) Ligand activity plot shows the top ligands of KPCSmad4-KO PDAC organoids inferred to regulate target genes in co-cultured PSCs, as assessed by NicheNet analysis of RNA-seq. (B) RNA-seq expression of Il1a in KPCSmad4-WT or KPCSmad4-KO organoids flow-sorted from monocultures or co-cultures with PSCs. Results show mean ± SEM. *, P < 0.05, **, P < 0.01, Mann-Whitney test. (C-D) Ligand activity plots show the top ligands of PSCs in co-culture with KPCSmad4-KO organoids inferred to regulate target genes in (C) PSCs or (D) co-cultured organoids, as assessed by NicheNet analysis. (E) Selected GSEA pathways significantly enriched or depleted in KPCSmad4-KO compared to KPCSmad4-WT malignant cells flow-sorted from monocultures or co-cultures with PSCs. The smooth pattern indicates the monocultures. Inflammatory pathways are in orange. Proliferation-associated pathways are in brown. Cocx, co-culture; monocx, monoculture. (F) Western blot analysis of p-STAT3 and STAT3 in KPCSmad4-WT or KPCSmad4-KO organoids cultured in reduced media for 2 days. ACTIN, loading control. (G) Selected significantly upregulated or downregulated pathways identified by GSEA of malignant cells from KPCSmad4-KO tumors (n=6) compared to malignant cells from KPCSmad4-WT tumors (n=3), as assessed by pseudobulk analysis of scRNA-seq. Inflammatory pathways are in orange. (H-I) UMAP plots of malignant cells from KPCSmad4-WT or KPCSmad4-KO tumors colored by the NES of the HALLMARK IL6 JAK STAT3 signaling (H) or the KEGG NF-κB signaling (I) pathways, as analyzed by scRNA-seq. (J-K) Western blot analysis of p-STAT3, STAT3, phospho-SMAD2/3 (p-SMAD2/3) and SMAD2 in KPCSmad4-WT or KPCSmad4-KO organoids cultured for 3 days in reduced media with (J) 5 μg/mL anti-IL1α or isotype control, or (K) 10 ng/mL IL1-α. ACTIN, loading controls. (L) qPCR analysis of Il1a, Lif, Il1r1, and Tgfb1 in KPCSmad4-WT or KPCSmad4-KO organoids cultured for 2 days in reduced media with or without 5-20 ng/mL TGF-β in the presence or absence of 2 μM TGFBR1 inhibitor A83-01 (TGFBRi). Results show mean ± SEM. *, P < 0.05; **, P < 0.01; ***, P < 0.001, paired and unpaired Student’s t test. (M) RNA-seq expression of Tgfb1 in KPCSmad4-WT or KPCSmad4-KO organoids flow-sorted from monocultures or co-cultures with PSCs. Results show mean ± SEM. *, P < 0.05; **, P < 0.01, Mann-Whitney test. (N) Western blot analysis of p-STAT3, STAT3, phospho-p44/42 (p-p44/42) and p44/42 in KPCSmad4-WT or KPCSmad4-KO organoids cultured for 2 days in reduced media with 5 ng/mL TGF-β. HSP60, loading control. (O) qPCR analysis of Il1a, Tgfb1, Lif, and Dusp6 (i.e. a MAPK MEK/ERK target) in KPCSmad4-WT or KPCSmad4-KO organoids cultured for 3 days in reduced media with DMSO or 1-2 nM MEK inhibitor trametinib (MEKi). Results show mean ± SEM. *, P < 0.05; **, P < 0.01; ***, P < 0.001, paired and unpaired Student’s t test.
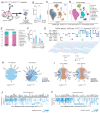
Figure 6
Figure 6. Smad4 loss impacts the immune TME and malignant-stromal crosstalk in KvPC PDAC.
(A) Schematic of analyses of KvPC (i.e. KrasG12V p53-mutant) orthotopically-grafted organoid-derived PDAC models in nu/nu mice. (B) Volumes of tumors derived from the transplantation of Smad4 WT or Smad4 KO KvPC (i.e. KrasG12V p53 mutant) PDAC organoids, measured by U/S. Results show mean ± SEM from 3 separate experiments, each with 1 WT group and 2 groups of KO pools from 2 different guides (29 days (cohort 1), 30 days (cohort 2) or 65 days (cohort 3) post-transplant). ***, P < 0.001, Mann-Whitney test. (C-D) UMAP plot of all cell types from KvPCSmad4-WT (n=4) or KvPCSmad4-KO (n=4) PDAC tumors analyzed by scRNA-seq, color-coded by genotype (C) or cell type clusters (D). (E) Cell type contribution in KvPCSmad4-WT or KvPCSmad4-KO tumors. (F) Flow cytometric analysis of neutrophils (CD45+CD11b+Gr1+) and macrophages (CD45+Gr1-CD11b+F4/80+) from live singlets in KvPCSmad4-WT or KvPCSmad4-KO tumors. Results show mean ± SEM from 3 separate experiments, each with 1 WT group and 2 groups of KO pools from 2 different guides. ***, P < 0.001, Mann-Whitney test. (G) Selected ligand-receptor interactions and their strength based on CellChat analysis between malignant cells, fibroblasts, macrophages, and neutrophils in KvPCSmad4-KO compared to KvPCSmad4-WT tumors. (H-I) Selected pathways with significantly different connections between malignant cells, fibroblasts, macrophages, and neutrophils in KvPCSmad4-KO compared to KvPCSmad4-WT tumors. (J-K) Ligand-target heatmaps show top selected ligands of malignant cells inferred to target genes in macrophages (J) and neutrophils (K) in KvPCSmad4-KO PDAC, as assessed by NicheNet analysis of scRNA-seq.
Figure 7
Figure 7. Smad4 loss drives a fibro-inflammatory stroma in KvPC PDAC.
(A) Ligand activity plot shows the top ligands of malignant cells inferred to regulate target genes in fibroblasts in KvPCSmad4-KO PDAC, as assessed by NicheNet analysis of scRNA-seq. (B-C) Ligand-target heatmaps show top selected ligands of (B) malignant cells inferred to regulate target genes in fibroblasts and (C) fibroblasts inferred to regulate target genes in malignant cells in KPCSmad4-KO PDAC, as assessed by NicheNet analysis. (D) UMAP plot of malignant cells from KvPCSmad4-WT (n=4) or KvPCSmad4-KO (n=4) tumors analyzed by scRNA-seq, color-coded by genotype. (E) Dot plot visualization of the scaled average expression of Smad4, Il1a and Il1b in malignant cells of KvPCSmad4-WT or KvPCSmad4-KO tumors, as analyzed by scRNA-seq. Color intensity represents expression level and dot size represents the percentage of expressing cells. (F-G) UMAP plots of CAFs from KvPCSmad4-WT or KvPCSmad4-KO tumors analyzed by scRNA-seq, color-coded by genotype (F) or sub-cluster (G). (H) Selected significantly upregulated (i.e. NES > 1.50 and FDR < 0.25; apart from the NF-kappa B signaling pathway with NES = 1.49) and downregulated (i.e. NES < -1.50 and FDR < 0.25; apart from the fatty acid metabolism with NES = -1.48) pathways identified by GSEA of CAFs from KvPCSmad4-KO compared to KvPCSmad4-WT tumors, as assessed by pseudobulk analysis from scRNA-seq. The in vivo iCAF signature is from Elyada et al (3). The in vitro iCAF signature is from Öhlund et al (4). The TGF-β-induced myCAF in vitro signature is from Mucciolo and Araos Henríquez et al (11). The cCAF3 signature is from McAndrews et al (8). (I-J) Flow cytometric analyses of (I) myCAFs (Ly6C-MHCII- CAFs), iCAFs (Ly6C+MHCII- CAFs) and apCAFs (Ly6C-MHCII+ CAFs), and (J) CD90+, CD49E+, CD56+ and CD105+ CAFs from live singlets in KvPCSmad4-WT or KvPCSmad4-KO tumors. Results show mean ± SEM from 3 separate experiments, each with 1 WT group and 2 groups of KO pools from 2 different guides. *, P < 0.05; **, P < 0.01; ***, P < 0.001, Mann-Whitney test. (K) UMAP plot of neutrophils from KvPCSmad4-WT or KvPCSmad4-KO PDAC analyzed by scRNA-seq. Different sub-clusters are color-coded. (L) GSEA of T3 neutrophil signature in neutrophils from KvPCSmad4-KO compared to KvPCSmad4-WT PDAC. The signature from Ng et al (13) is not significantly altered. (M) UMAP plot of macrophages from KvPCSmad4-WT or KvPCSmad4-KO tumors analyzed by scRNA-seq. Different sub-clusters are color-coded. (N) Dot plot visualization of the scaled average expression of macrophage markers in macrophages from KvPCSmad4-WT or KvPCSmad4-KO tumors analyzed by scRNA-seq. Color intensity represents expression level and dot size represents the percentage of expressing cells.
Figure 8
Figure 8. Smad4 loss tunes signaling dependencies in PDAC with distinct KRAS status.
(A) Selected significantly upregulated or downregulated pathways identified by GSEA of malignant cells from KvPCSmad4-KO PDAC (n=4) compared to malignant cells from KvPCSmad4-WT tumors (n=4), as assessed by pseudobulk analysis of the scRNA-seq dataset. (B) Schematic of flow-sorting strategy of PSCs and KvPCSmad4-WT or KvPCSmad4-KO PDAC organoids from monocultures or co-cultures for RNA-seq analysis. (C) Selected significantly upregulated and downregulated pathways identified by GSEA of PSCs cultured with KvPCSmad4-KO organoids (n=8) compared to PSCs cultured with KvPCSmad4-WT organoids (n=4). The in vivo iCAF and myCAF signatures are from Elyada et al (3). The in vitro iCAF and myCAF signatures are from Öhlund et al (4). The TGF-β-induced myCAF in vitro signature is from Mucciolo and Araos Henríquez et al (11). The LRRC15+ CAF and cCAF3 signatures are from Dominguez et al (7) and McAndrews et al (8), respectively. (D) Selected pathways found significantly enriched or depleted by GSEA in KvPCSmad4-KO malignant cells compared to KvPCSmad4-WT malignant cells flow-sorted from monocultures or co-cultures with PSCs. The smooth pattern indicates the monocultures. Inflammatory pathways are highlighted in orange. (E) Western blot analysis of p-STAT3, STAT3, p-SMAD2/3 and SMAD2 in KvPCSmad4-WT or KvPCSmad4-KO organoids cultured in reduced media for 2 days. ACTIN, loading control. (F) Western blot analysis of p-STAT3 and STAT3 in KvPCSmad4-WT or KvPCSmad4-KO organoids cultured for 2 days in reduced media with or without 8 μM of the JAK inhibitor (JAKi, AZD1480). ACTIN, loading control. (G) Proliferation curves of KvPCSmad4-WT and KvPCSmad4-KO organoids cultured for 144 hours in reduced media with or without 8 μM JAKi. Data were normalized to the first measurement (3 hours post-plating) and to the DMSO control. Results show mean ± SEM of n=3 biological replicates (with n=6 technical replicates each). No statistical difference was found by Mann-Whitney test. (H) Western blot analysis of p-STAT3 and STAT3 in KPCSmad4-WT or KPCSmad4-KO organoids cultured for 2 days in reduced media with or without 8 μM of the JAKi. ACTIN, loading control. (I) Proliferation curves of KPCSmad4-WT and KPCSmad4-KO organoids cultured for 144 hours in reduced media with or without 8 μM JAKi. Data were normalized to the first measurement (3 hours post-plating) and to the DMSO control. Results show mean ± SEM of n=3 biological replicates (with n=6 technical replicates each). ***, P < 0.001, Mann-Whitney test. (J) Schematic of experimental design and downstream analyses of a 2-week JAKi treatment of KPCSmad4-WT and KPCSmad4-KO organoid-derived PDAC models in C57BL/6J mice. (K) Tumor growth (i.e. ratio of tumor volume at day 14 and tumor volume at day -1), measured by U/S, of 2-week vehicle- and JAKi-treated KPCSmad4-WT or KPCSmad4-KO PDAC tumors. Results show mean ± SEM from 3 separate experiments. ***, P < 0.001, Mann-Whitney test. (L) Percentage of KPCSmad4-WT and KPCSmad4-KO tumor-bearing mice with metastases in the liver, lungs and diaphragm following 2 weeks of treatment with vehicle or JAKi. Results show data from 3 experiments. **, P < 0.01, ***, P < 0.001, chi-square test. (M) Representative cleaved caspase 3 (CC3) immunohistochemistry (IHC) stains in 2-week vehicle- or JAKi- treated KPCSmad4-WT and KPCSmad4-KO PDAC tumors. Scale bars, 50 μm. (N) Quantification of CC3 stain in 2-week vehicle- or JAKi-treated KPCSmad4-WT and KPCSmad4-KO PDAC tumors. Results show mean ± SEM from 3 separate experiments. **, P < 0.01; ***, P < 0.001, Mann-Whitney test. (O) Model illustrating how Smad4 loss differently shapes murine KRASG12D (a) or KRASG12V (b) p53 mutant PDAC tumors, including their progression, tumor microenvironment and therapeutic sensitivity.

References

    1. Siegel RL, Giaquinto AN, Jemal A. Cancer statistics, 2024. CA: A Cancer Journal for Clinicians. 2024;74:12–49. - PubMed
    1. Biffi G, Tuveson DA. Diversity and Biology of Cancer-Associated Fibroblasts. Physiol Rev. 2021;101:147–76. doi: 10.1152/physrev.00048.2019. - DOI - PMC - PubMed
    1. Elyada E, Bolisetty M, Laise P, Flynn WF, Courtois ET, Burkhart RA, et al. Cross-species single-cell analysis of pancreatic ductal adenocarcinoma reveals antigen-presenting cancer-associated fibroblasts. Cancer Discov. 2019 doi: 10.1158/2159-8290.CD-19-0094. - DOI - PMC - PubMed
    1. Ohlund D, Handly-Santana A, Biffi G, Elyada E, Almeida AS, Ponz-Sarvise M, et al. Distinct populations of inflammatory fibroblasts and myofibroblasts in pancreatic cancer. J Exp Med. 2017;214:579–96. doi: 10.1084/jem.20162024. - DOI - PMC - PubMed
    1. Biffi G, Oni TE, Spielman B, Hao Y, Elyada E, Park Y, et al. IL1-Induced JAK/STAT Signaling Is Antagonized by TGFbeta to Shape CAF Heterogeneity in Pancreatic Ductal Adenocarcinoma. Cancer Discov. 2019;9:282–301. doi: 10.1158/2159-8290.CD-18-0710. - DOI - PMC - PubMed

MeSH terms