. 2025 Jan 2;66(1):50.
doi: 10.1167/iovs.66.1.50.

DNA-Dependent Protein Kinase Catalytic Subunit Prevents Ferroptosis in Retinal Pigment Epithelial Cells

Affiliations

DNA-Dependent Protein Kinase Catalytic Subunit Prevents Ferroptosis in Retinal Pigment Epithelial Cells

Xueying Wang et al. Invest Ophthalmol Vis Sci. .

Abstract

Purpose: The purpose of this study was to investigate the activated core kinases involved in the DNA damage responses (DDR) during ferroptosis of retinal pigment epithelial (RPE) cells in vitro and their regulatory effects on ferroptosis.

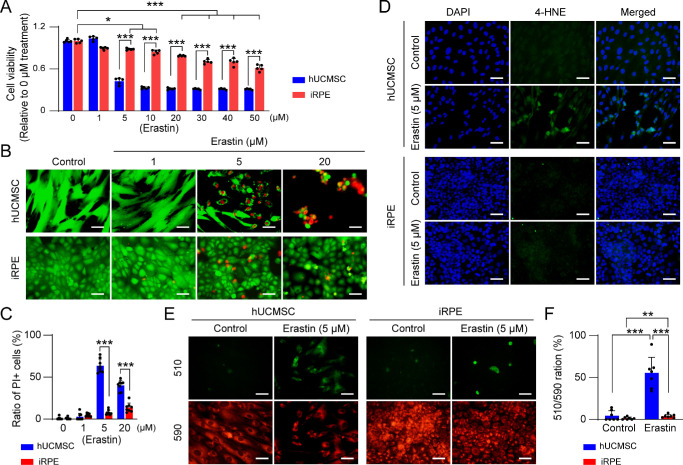
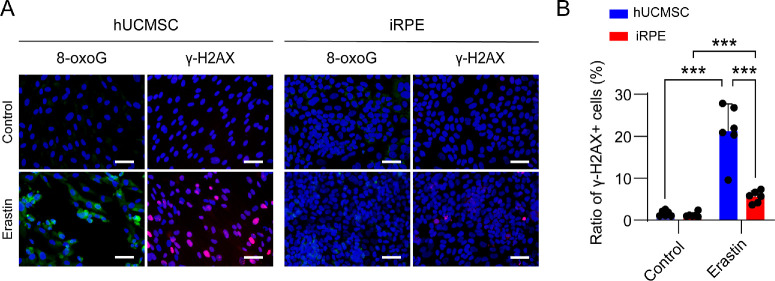
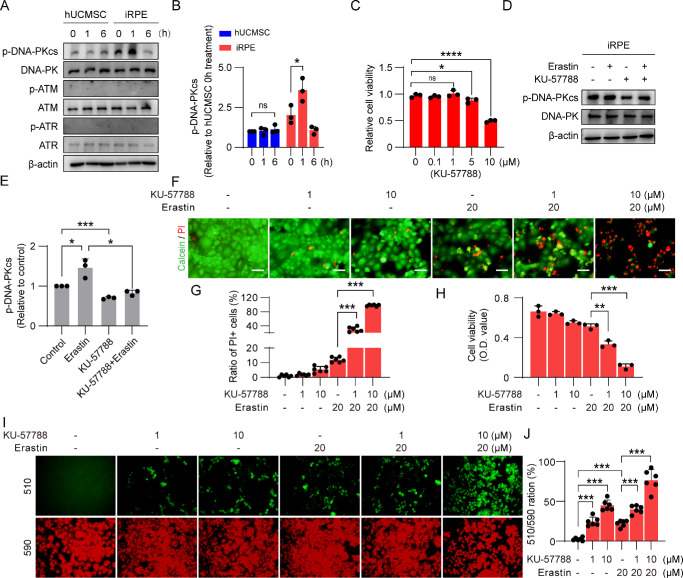
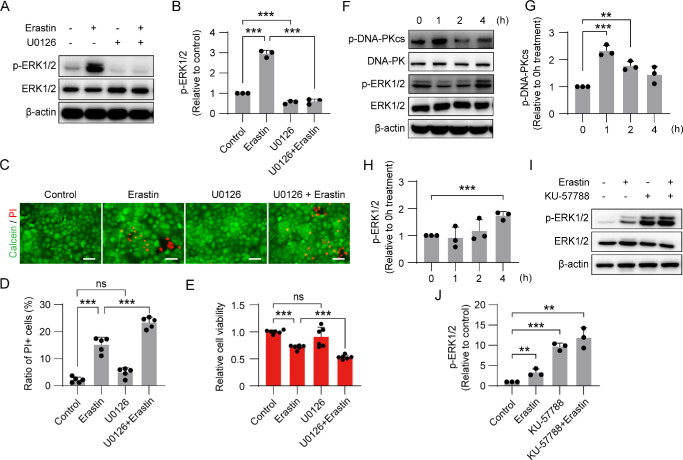
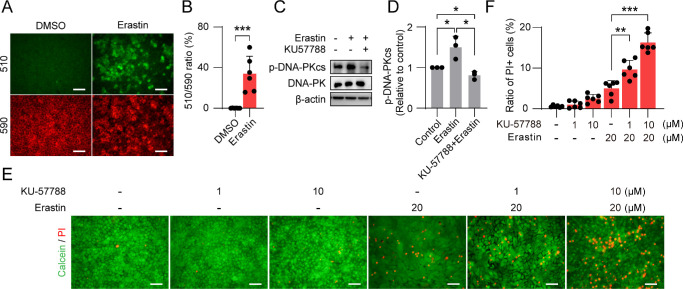
Methods: Ferroptosis was induced by erastin in induced RPE (iRPE) cells derived from human umbilical cord mesenchymal stem cells (hUCMSCs), hUCMSCs, and induced pluripotent stem cell-derived RPE (iPSC-RPE) cells. CCK8 was employed to measure the cell viability. Calcein/PI staining was used to detect the ferroptotic cells. The γ-H2AX, 8-oxoG, and phosphorylated DNA-dependent protein kinase catalytic subunit (DNA-PKcs) were determined through immunostaining. The phosphorylation of DNA-PKcs and ERK1/2 was determined by Western blotting. Lipid peroxides were detected by BODIPY581/591-C11 staining.

Results: The iRPE cells exhibited a stronger ability to resist ferroptosis compared to hUCMSCs. Ferroptosis induced DNA damage in cells, and DNA-PKcs was rapidly phosphorylated in iRPE cells on the treatment of erastin. In addition, inhibition of DNA-PKcs phosphorylation promoted ferroptosis in iRPE cells, suggesting that DNA-PKcs prevents ferroptosis. Meanwhile, DNA-PKcs inhibited ERK1/2 phosphorylation only at the early stage of ferroptosis induction, whereas ERK1/2 phosphorylation played a protective role in iRPE cells. Furthermore, erastin inducing DNA-PKcs phosphorylation and inhibition of its phosphorylation promoting ferroptosis were also verified in iPSC-RPE cells.

Conclusions: The present study elucidates that the key DDR kinase DNA-PKcs is activated and plays protective role during ferroptosis in RPE cells in vitro, which will provide new research targets and strategies for inhibiting ferroptosis in RPE cells.


Conflict of interest statement

Disclosure: X. Wang, None; X. Wang, None; Z. Zhao, None; Q. Wang, None; X. Zhu, None; Q. Ou, None; J.-Y. Xu, None; L. Lu, None; F. Gao, None; J. Wang, None; Y. Bi, None; G.-T. Xu, None; C. Jin, None; H. Tian None

Figures

Figure 1.
Figure 1.
iRPE cells are more resistant to ferroptosis than hUCMSCs. (A) Ferroptosis was induced by erastin with different doses (n = 5 per dose), and cell viability was analyzed by the CCK-8 after cells were treated for 24 hours. (B) Calcein/PI staining revealed PI+ cells. Scale bar: 50 µm. (C) Quantitative analysis of the proportion of PI+ cells (n = 8). (D) 4-HNE immunostaining in representative micrographs of hUCMSCs and iRPE cells after treated with 5 µM erastin for 12 hours. Scale bar: 50 µm. (E) Peroxidized lipids were detected by BODIPY581/591-C11 staining after cells were treated with 5 µM erastin for 12 hours. (F) The production of peroxidized lipids was determined as the ratio of the cells with fluorescence of 510 wave length over the cells with fluorescence of 590 wave length (n = 7). Data are mean ± SD, *P < 0.05, **P < 0.01, ***P < 0.001 using Student's t-test or one-way ANOVA and post hoc Bonferroni's test.
Figure 2.
Figure 2.
Ferroptosis induces DNA damages. (A) Immunostaining of 8-oxoG and γ-H2AX in hUCMSCs and iRPE was detected after treated with 5 µM erastin for 12 hours. Scale bar: 50 µm. (B) Quantitative analysis of γ-H2AX+ cells (n = 6). Data are mean ± SD, ***P < 0.001 using one-way ANOVA and post hoc Bonferroni's test.
Figure 3.
Figure 3.
DNA-PKcs inhibits erastin-induced ferroptosis. (A, B) The phosphorylation of DNA-PKcs, ATM, and ATR was determined by (A) Western blot and (B) quantitative analysis of phosphorylation of DNA-PKcs after being treated with 20 µM erastin (n = 3) . (C) Cell viability was analyzed by the CCK-8 after iRPE cells were treated with KU-57788 for 24 hours (n = 3). (D, E) The phosphorylation of DNA-PKcs in iRPE cells was determined by (D) Western blot and (E) quantitative analysis (n = 3). (F) Calcein/PI staining revealed PI+ iRPE cells. Scale bar: 50 µm. (G) Quantitative analysis of the proportion of PI+ iRPE cells (n = 6). (H) Cell viability was analyzed by the CCK-8 after iRPE cells were treated with KU-57788 or erasin for 24 hours (n = 3). (I) Peroxidized lipids were detected by BODIPY581/591-C11 staining after cells were treated with KU-57788 or erastin for 12 hours. (J) The production of peroxidized lipids was determined as the ratio of the cells with fluorescence of 510 wave length over the cells with fluorescence of 590 wave length (n = 6). Data are mean ± SD, *P < 0.05, **P < 0.01, ***P < 0.001 using one-way ANOVA and post hoc Bonferroni's test.
Figure 4.
Figure 4.
DNA-PKcs inhibits the phosphorylation of ERK1/2. (A, B) iRPE cells were treated with erastin or 2 µM U0126 for four hours, the phosphorylation of ERK1/2 was determined by (A) Western blot and (B) quantitative analysis (n = 3). (C) Calcein/PI staining revealed PI+ iRPE cells treated with 20 µM erastin or 2 µM U0126 for 12 hours. Scale bar: 50 µm. (D) Quantitative analysis of the proportion of PI+ iRPE cells (n = 5). (E) Cell viability was analyzed by the CCK-8 after iRPE cells were treated with erastin or U0126 for 24 hours (n = 6). (FH) The time courses of phosphorylation of DNA-PKcs and ERK1/2 were determined by (F) Western blot and (G, H) quantitative analysis after treated with 20 µM erastin (n = 3). (I, J) The iRPE cells were treated with 20 µM erastin or 1 µM KU-57788 for four hours, and the phosphorylation of ERK1/2 was determined by (I) Western blot and (J) quantitative analysis (n = 3). Data are mean ± SD, **P < 0.01, ***P < 0.001 using one-way ANOVA and post hoc Bonferroni's test.
Figure 5.
Figure 5.
DNA-PKcs inhibits ferroptosis in iPSC-RPE cells. (A, B) Peroxidized lipids were detected by BODIPY581/591-C11 staining, the production of peroxidized lipids was determined as the ratio of the cells with fluorescence of 510 wave length over the cells with fluorescence of 590 wave length (n = 6). (C, D) iPSC-RPE cells were treated with erastin or KU-57788 for one hours, the phosphorylation of DNA-PKcs was determined by (C) Western blot and (D) quantitative analysis (n = 3). (E) Calcein/PI staining revealed PI+ iPSC-RPE cells treated with erastin or KU-57788 for 24 hours. Scale bar: 50 µm. (F) Quantitative analysis of the proportion of PI+ iRPE cells (n = 6). Data are mean ± SD, *P < 0.05, **P < 0.01, ***P < 0.001 using Student's t-test or one-way ANOVA and post hoc Bonferroni's test.

Similar articles

References

    1. Biesemeier A, Yoeruek E, Eibl O, Schraermeyer U. Iron accumulation in Bruch's membrane and melanosomes of donor eyes with age-related macular degeneration. Exp Eye Res. 2015; 137: 39–49. - PubMed
    1. Song D, Kanu LN, Li Y, et al. .. AMD-like retinopathy associated with intravenous iron. Exp Eye Res. 2016; 151: 122. - PMC - PubMed
    1. Shu W, Baumann BH, Song Y, Liu Y, Wu X, Dunaief JL. Ferrous but not ferric iron sulfate kills photoreceptors and induces photoreceptor-dependent RPE autofluorescence. Redox Biol. 2020; 34: 101469. - PMC - PubMed
    1. Tang Z, Ju Y, Dai X, et al. .. HO-1-mediated ferroptosis as a target for protection against retinal pigment epithelium degeneration. Redox Biol. 2021; 43: 101971. - PMC - PubMed
    1. Chao C, Yang K, He D, Yang B. Induction of ferroptosis by HO-1 contributes to retinal degeneration in mice with defective clearance of all-trans-retinal. Free Radic Biol Med. 2023; 194: 245–254. - PubMed