Meta-Analysis
. 2025 Jan 22:12:RP88652.
doi: 10.7554/eLife.88652.

Multi-study fMRI outlooks on subcortical BOLD responses in the stop-signal paradigm

Affiliations
Meta-Analysis

Multi-study fMRI outlooks on subcortical BOLD responses in the stop-signal paradigm

Scott Isherwood et al. Elife. .

Abstract

This study investigates the functional network underlying response inhibition in the human brain, particularly the role of the basal ganglia in successful action cancellation. Functional magnetic resonance imaging (fMRI) approaches have frequently used the stop-signal task to examine this network. We merge five such datasets, using a novel aggregatory method allowing the unification of raw fMRI data across sites. This meta-analysis, along with other recent aggregatory fMRI studies, does not find evidence for the innervation of the hyperdirect or indirect cortico-basal-ganglia pathways in successful response inhibition. What we do find, is large subcortical activity profiles for failed stop trials. We discuss possible explanations for the mismatch of findings between the fMRI results presented here and results from other research modalities that have implicated nodes of the basal ganglia in successful inhibition. We also highlight the substantial effect smoothing can have on the conclusions drawn from task-specific general linear models. First and foremost, this study presents a proof of concept for meta-analytical methods that enable the merging of extensive, unprocessed, or unreduced datasets. It demonstrates the significant potential that open-access data sharing can offer to the research community. With an increasing number of datasets being shared publicly, researchers will have the ability to conduct meta-analyses on more than just summary data.

Keywords: MRI; SST; human; inhibition; neuroscience; subcortex.


Conflict of interest statement

SI, SK, SM, NS, PB, BF No competing interests declared

Figures

Figure 1.
Figure 1.. Corrected and uncorrected temporal signal-to-noise ratio (tSNR) values for five regions of interest (ROIs) over all datasets.
The values are derived from the mean tSNR values of both hemispheres. Error bars are standard errors. Corrected tSNRs are equal to the uncorrected tSNRs divided by the volume of a single voxel. IFG, inferior frontal gyrus; SN, substantia nigra; STN, subthalamic nucleus; Tha, thalamus; VTA, ventral tegmental area.
Figure 2.
Figure 2.. Group-level statistical parametric maps (SPMs) of the three main contrasts of the stop-signal task (SST).
Activation colours indicate false discovery rate (FDR) thresholded (q < 0.05) z-values. Two sagittal, one axial, and one zoomed in coronal view are shown. Coloured contour lines indicate regions of interest (inferior frontal gyrus [IFG] in white, M1 in grey, pre-supplementary motor area [preSMA] in orange, Caudate in dark blue, Putamen in light blue, GPe in dark green, globus pallidus interna [GPi] in light green, substantia nigra [SN] in pink, subthalamic nucleus [STN] in red, thalamus in yellow, and ventral tegmental area [VTA] in black). The background template and coordinates are in MNI2009c (1 mm). FS, failed stop; SS, successful stop.
Figure 2—figure supplement 1.
Figure 2—figure supplement 1.. Group-level statistical parametric maps (SPMs) of the FS > GO contrast of the stop-signal task (SST) for each dataset.
Activation colours indicate false discovery rate (FDR) thresholded (q < 0.05) z-values. Sagittal (top), axial (middle), and a zoomed in coronal (bottom) view are shown. Coloured contour lines indicate regions of interest (inferior frontal gyrus [IFG] in white, M1 in grey, pre-supplementary motor area [preSMA] in orange, Caudate in dark blue, Putamen in light blue, GPe in dark green, globus pallidus interna [GPi] in light green, substantia nigra [SN] in pink, subthalamic nucleus [STN] in red, thalamus in yellow, and ventral tegmental area [VTA] in black). The background template and coordinates are in MNI2009c (1 mm); slices are drawn through x = 51 (top), y = −13 (bottom), and z = 2 (middle).
Figure 2—figure supplement 2.
Figure 2—figure supplement 2.. Group-level statistical parametric maps (SPMs) of the FS > SS contrast of the stop-signal task (SST) for each dataset.
Activation colours indicate false discovery rate (FDR) thresholded (q < 0.05) z-values. Sagittal (top), axial (middle), and a zoomed in coronal (bottom) view are shown. Coloured contour lines indicate regions of interest (inferior frontal gyrus [IFG] in white, M1 in grey, pre-supplementary motor area [preSMA] in orange, Caudate in dark blue, Putamen in light blue, GPe in dark green, globus pallidus interna [GPi] in light green, substantia nigra [SN] in pink, subthalamic nucleus [STN] in red, thalamus in yellow, and ventral tegmental area [VTA] in black). The background template and coordinates are in MNI2009c (1 mm); slices are drawn through x = 51 (top), y = −13 (bottom), and z = 2 (middle).
Figure 2—figure supplement 3.
Figure 2—figure supplement 3.. Group-level statistical parametric maps (SPMs) of the SS > GO contrast of the stop-signal task (SST) for each dataset.
Activation colours indicate false discovery rate (FDR) thresholded (q < 0.05) z-values. Sagittal (top), axial (middle), and a zoomed in coronal (bottom) view are shown. Coloured contour lines indicate regions of interest (inferior frontal gyrus [IFG] in white, M1 in grey, pre-supplementary motor area [preSMA] in orange, Caudate in dark blue, Putamen in light blue, GPe in dark green, globus pallidus interna [GPi] in light green, substantia nigra [SN] in pink, subthalamic nucleus [STN] in red, thalamus in yellow, and ventral tegmental area [VTA] in black). The background template and coordinates are in MNI2009c (1 mm); slices are drawn through x = 51 (top), y = −13 (bottom), and z = 2 (middle).
Figure 2—figure supplement 4.
Figure 2—figure supplement 4.. Group-level statistical parametric maps (SPMs) of the three main contrasts of the stop-signal task (SST), where SS and FS trials were time-locked to the presentation of the stop signal.
Activation colours indicate false discovery rate (FDR) thresholded (q < 0.05) z-values. Two sagittal, one axial, and one zoomed in coronal view are shown. Coloured contour lines indicate regions of interest (inferior frontal gyrus [IFG] in white, M1 in grey, pre-supplementary motor area [preSMA] in orange, Caudate in dark blue, Putamen in light blue, GPe in dark green, globus pallidus interna [GPi] in light green, substantia nigra [SN] in pink, subthalamic nucleus [STN] in red, thalamus in yellow, and ventral tegmental area [VTA] in black). The background template and coordinates are in MNI2009c (1 mm). FS, failed stop; SS, successful stop.
Figure 3.
Figure 3.. Group-level z-scores from the region of interest (ROI)-wise general linear model (GLM) analysis of included datasets.
Thresholds are set using false discovery rate (FDR) correction (q < 0.05), varying between contrasts. The thresholds for each contrast are as follows: 3.01 for FS > GO, 2.26 for FS > SS, and 3.1 for SS > GO. Regions that do not reach significance are coloured white. Left and right hemispheres are shown separately, denoted by ‘-l’ or ‘-r’, respectively. IFG, inferior frontal gyrus; M1, primary motor cortex; preSMA, pre-supplementary motor area; GPe, globus pallidus externa; GPi, globus pallidus interna; SN, substantia nigra; STN, subthalamic nucleus; Tha, thalamus; VTA, ventral tegmental area.
Figure 3—figure supplement 1.
Figure 3—figure supplement 1.. Group-level z-scores from the region of interest (ROI)-wise general linear model (GLM) analysis of included datasets, where SS and FS trials were time-locked to the presentation of the stop signal.
Thresholds are set using false discovery rate (FDR) correction (q < 0.05), varying between contrasts. The thresholds for each contrast are as follows: 3.01 for FS > GO, 2.26 for FS > SS, and 3.1 for SS > GO. Regions that do not reach significance are coloured white. Left and right hemispheres are shown separately, denoted by ‘-l’ or ‘-r’, respectively. IFG, inferior frontal gyrus; M1, primary motor cortex; preSMA, pre-supplementary motor area; GPe, globus pallidus externa; GPi, globus pallidus interna; SN, substantia nigra; STN, subthalamic nucleus; Tha, thalamus; VTA, ventral tegmental area.
Figure 3—figure supplement 2.
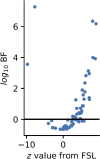
Figure 3—figure supplement 2.. A comparison of the BFs and the frequentist z-scores from FSL.
The 0 point on each axis represents no evidence for an effect. Large absolute z-values are expected to also yield a high log BF, hence the inverted U-shape shows good correspondence between the two estimates.
Figure 4.
Figure 4.. Log-transformed Bayes Factors for each contrast based on parameter estimates from first-level model.
Colouring depicts evidence for each hypothesis based on a variation of Jeffreys’ scale. BFs more than 2 or less than 2 on a log scale are defined as extreme evidence. Refer to Table 4 for details on interpretation of log-transformed BFs. BFs were calculated for each contrast for both hemispheres of each region of interest (ROI). Left and right hemispheres are shown separately, denoted by ‘-l’ or ‘-r’, respectively. IFG, inferior frontal gyrus; M1, primary motor cortex; preSMA, pre-supplementary motor area; GPe, globus pallidus externa; GPi, globus pallidus interna; SN, substantia nigra; STN, subthalamic nucleus; Tha, thalamus; VTA, ventral tegmental area.
Figure 5.
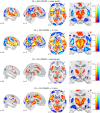
Figure 5.. Comparison of group-level statistical parametric maps (SPMs) for the SS > GO contrast using different smoothing kernels.
SPMs resulting from general linear models (GLMs) computed on base-level spatially smoothed data can be seen on the top row, with SPMs resulting from GLMs computed on data spatially smoothed with a full width half maximum (FWHM) of 5 mm. Activation colours indicate false discovery rate (FDR) thresholded (q < 0.05) z-values. Two sagittal, one axial, and one zoomed in coronal view are shown. Coloured contour lines indicate regions of interest (inferior frontal gyrus [IFG] in white, M1 in grey, pre-supplementary motor area [preSMA] in orange, Caudate in dark blue, Putamen in light blue, GPe in dark green, globus pallidus interna [GPi] in light green, substantia nigra [SN] in pink, subthalamic nucleus [STN] in red, thalamus in yellow, and ventral tegmental area [VTA] in black). The background template and coordinates are in MNI2009c (1 mm). FS, failed stop; SS, successful stop.
Figure 5—figure supplement 1.
Figure 5—figure supplement 1.. Group-level statistical parametric maps (SPMs) of the FS > GO and FS > SS contrasts using different smoothing kernels.
Activation colours indicate false discovery rate (FDR) thresholded (q < 0.05) z-values. Two sagittal, one axial, and one zoomed in coronal view are shown. Coloured contour lines indicate regions of interest (inferior frontal gyrus [IFG] in white, M1 in grey, pre-supplementary motor area [preSMA] in orange, Caudate in dark blue, Putamen in light blue, GPe in dark green, globus pallidus interna [GPi] in light green, substantia nigra [SN] in pink, subthalamic nucleus [STN] in red, thalamus in yellow, and ventral tegmental area [VTA] in black). The background template and coordinates are in MNI2009c (1 mm). FS, failed stop; SS, successful stop.

Update of

  • doi: 10.1101/2023.06.06.543900
  • doi: 10.7554/eLife.88652.1
  • doi: 10.7554/eLife.88652.2
  • doi: 10.7554/eLife.88652.3

Similar articles

Cited by

References

    1. Alberico SL, Cassell MD, Narayanan NS. The vulnerable ventral tegmental area in Parkinson’s Disease. Basal Ganglia. 2015;5:51–55. doi: 10.1016/j.baga.2015.06.001. - DOI - PMC - PubMed
    1. Alegre M, Lopez-Azcarate J, Obeso I, Wilkinson L, Rodriguez-Oroz MC, Valencia M, Garcia-Garcia D, Guridi J, Artieda J, Jahanshahi M, Obeso JA. The subthalamic nucleus is involved in successful inhibition in the stop-signal task: a local field potential study in Parkinson’s disease. Experimental Neurology. 2013;239:1–12. doi: 10.1016/j.expneurol.2012.08.027. - DOI - PubMed
    1. Alkemade A, Mulder MJ, Groot JM, Isaacs BR, van Berendonk N, Lute N, Isherwood SJ, Bazin P-L, Forstmann BU. The Amsterdam Ultra-high field adult lifespan database (AHEAD): A freely available multimodal 7 Tesla submillimeter magnetic resonance imaging database. NeuroImage. 2020;221:117200. doi: 10.1016/j.neuroimage.2020.117200. - DOI - PubMed
    1. Andraszewicz S, Scheibehenne B, Rieskamp J, Grasman R, Verhagen J, Wagenmakers EJ. An introduction to bayesian hypothesis testing for management research. Journal of Management. 2015;41:521–543. doi: 10.1177/0149206314560412. - DOI
    1. Aron AR, Dowson JH, Sahakian BJ, Robbins TW. Methylphenidate improves response inhibition in adults with attention-deficit/hyperactivity disorder. Biological Psychiatry. 2003;54:1465–1468. doi: 10.1016/s0006-3223(03)00609-7. - DOI - PubMed

Publication types