. 2025 Jan 28;122(4):e2412787122.
doi: 10.1073/pnas.2412787122. Epub 2025 Jan 22.

Retrospective SARS-CoV-2 human antibody development trajectories are largely sparse and permissive

Affiliations

Retrospective SARS-CoV-2 human antibody development trajectories are largely sparse and permissive

Monica B Kirby et al. Proc Natl Acad Sci U S A. .

Abstract

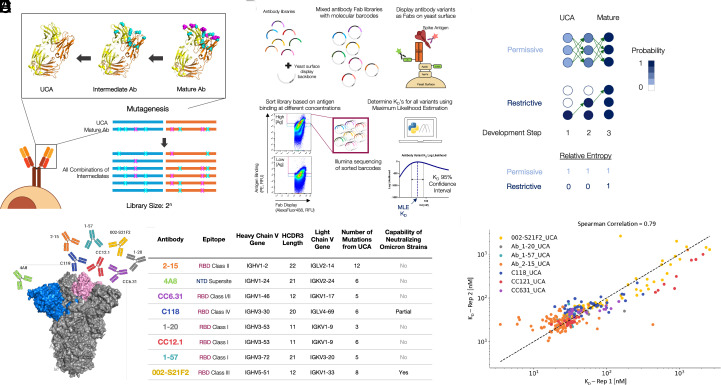
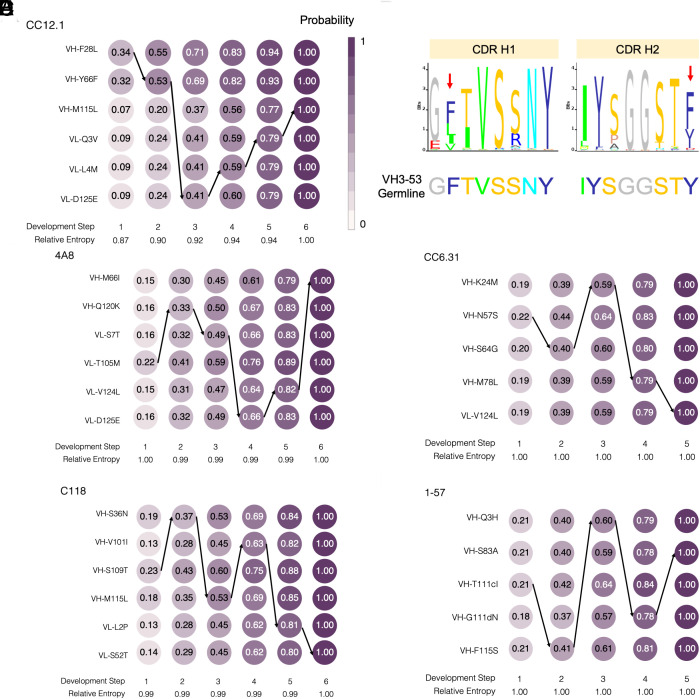
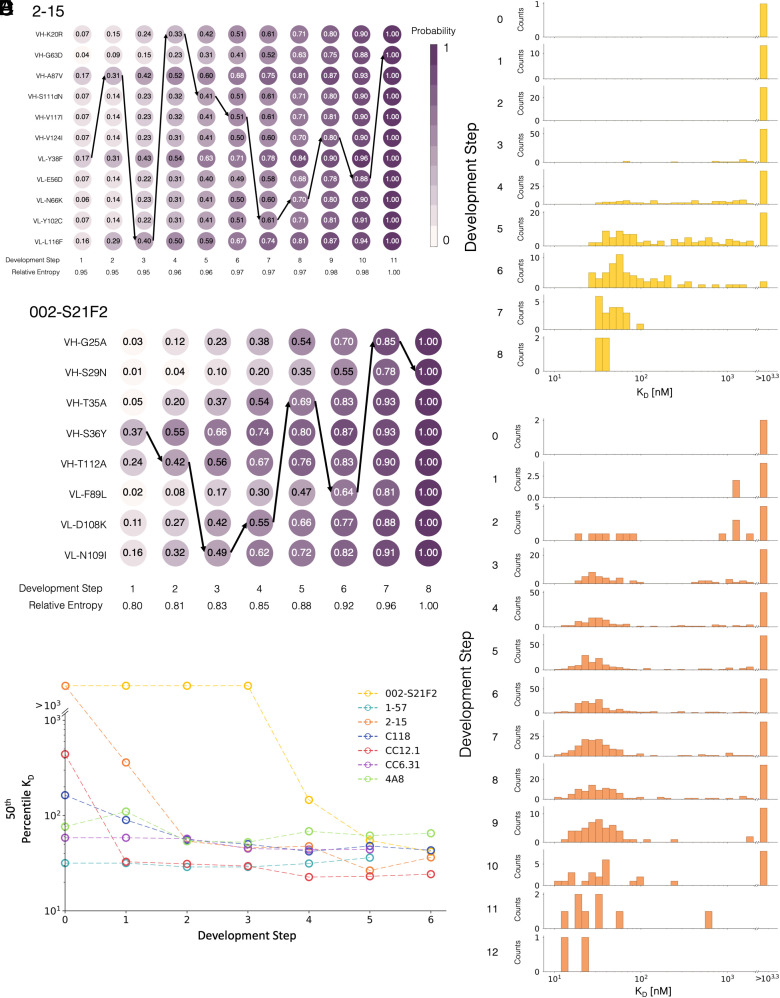
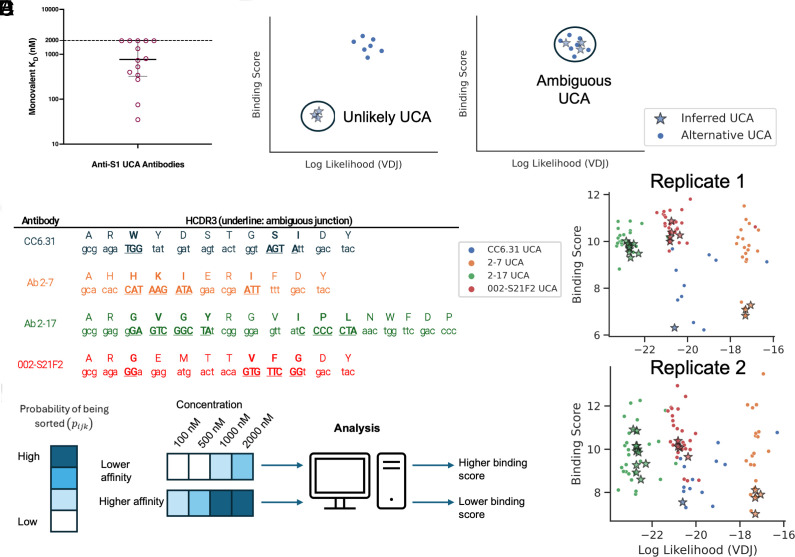
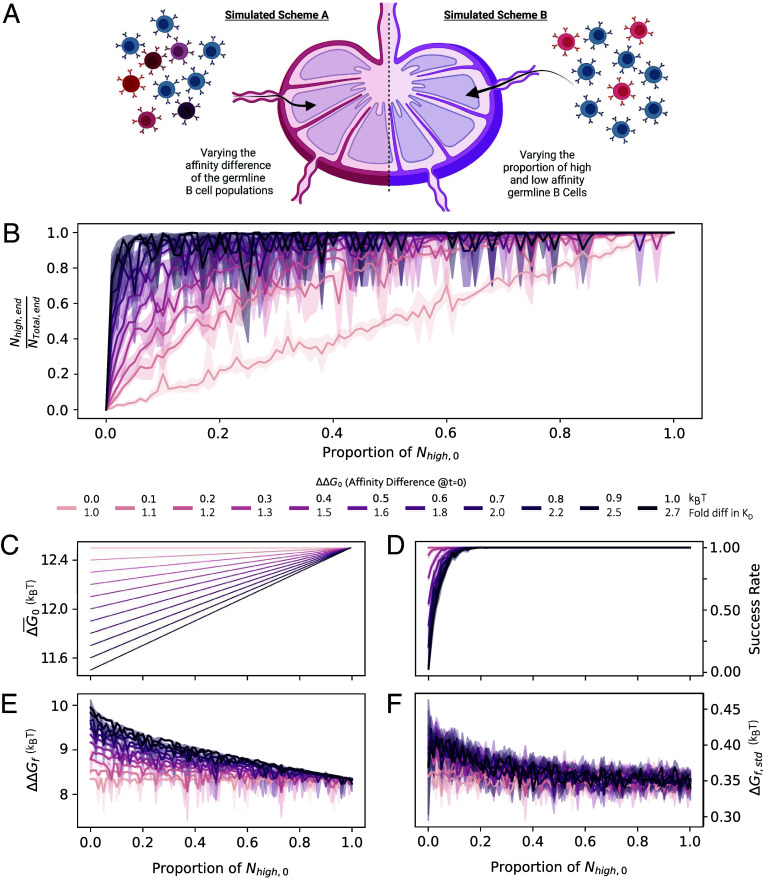
Immunological interventions, like vaccinations, are enabled by the predictive control of humoral responses to novel antigens. While the development trajectories for many broadly neutralizing antibodies (bnAbs) have been measured, it is less established how human subtype-specific antibodies develop from their precursors. In this work, we evaluated the retrospective development trajectories for eight anti-SARS-CoV-2 Spike human antibodies (Abs). To mimic the immunological process of BCR selection during affinity maturation in germinal centers (GCs), we performed deep mutational scanning on anti-S1 molecular Fabs using yeast display coupled to fluorescence-activated cell sorting. Focusing only on changes in affinity upon mutation, we found that human Ab development pathways have few mutations which impart changes in monovalent binding dissociation constants and that these mutations can occur in nearly any order. Maturation pathways of two bnAbs showed that while they are only slightly less permissible than subtype-specific Abs, more development steps on average are needed to reach the same level of affinity. Many of the subtype-specific Abs had inherent affinity for antigen, and these results were robust against different potential inferred precursor sequences. To evaluate the effect of differential affinity for precursors on GC outcomes, we adapted a coarse-grained affinity maturation model. This model showed that antibody precursors with minimal affinity advantages rapidly outcompete competitors to become the dominant clonotype.

Keywords: antibodies; antibody development; deep mutational scanning.


Conflict of interest statement

Competing interests statement:T.A.W. serves on the scientific advisory board at Metaphore and Alta Resource Technologies. The other authors have no interests to declare.

Figures

Fig. 1.
Fig. 1.
In vitro yeast pipeline for assessing antibody evolutionary trajectories. (A) Selected antibodies are sequenced aligned with their predicted UCA and a Fab combinatorial library is generated that consists of all possible mutations between the mature and UCA sequence. (B) Overview of MAGMA-seq pipeline enabling high-throughput measurements of antibody binding affinities. Pooled mutagenic antibody libraries are cloned into barcoded yeast surface display vectors and transformed into yeast and induced Fab yeast surface expression. The Fab library is sorted against antigen at different labeling concentrations based on antigen binding signal. The sorted populations are sequenced using only the barcoded region and maximum likelihood estimation is used to determine probable biophysical parameters for each variant. (C) Likely maturation pathways are scored and assessed using a relative entropy term. The colored circles represent the cumulative probabilities of encoding a given mutation in each development step toward the mature antibody. (D and E) Combinatorial libraries contain NTD targeting (4A8) and RBD targeting (2–15, CC6.31, C118, 1–20, CC12.1, 1–57, and 002-S21F2) Fabs. There is a diversity of antibody features (epitope, heavy and light chain V gene, HCDR3 length, number of mutations from UCA, Omicron neutralization capability) captured by the libraries. (F) KD correlation predicted by MAGMA-seq from biological replicate libraries.
Fig. 2.
Fig. 2.
Development pathways for human antibodies with limited SHM are sparse and highly permissive. (A) Reconstructed development pathway for VH3-53 germline antibody CC12.1. (B) Sequence logo profiling of known short CRDH3 VH3-53 anti-SARS-CoV-2 antibodies. VH positions 28 and 66 are demarcated by red arrows. (CF) Reconstructed development pathways and per-step relative entropies for (C) 4A8; (D) CC6.31; (E) C118; and (F) 1–57. For all plots, circles denote the cumulative probability of incorporating that mutation for each step of the development pathway. The solid arrow represents the most likely mutation fixed at each development step. Antibody positions are from IMGT numbering.
Fig. 3.
Fig. 3.
Development pathways for human SARS-CoV-2 antibodies with moderate SHM are permissive but start from moderate affinities. (A and B) Reconstructed development pathway and per-step relative entropies for (A) public VH1-2 class antibody 2–15 and (B) rare bnAb 002-S21F2. For all plots, circles denote the cumulative probability of incorporating that mutation for each step of the development pathway. The solid arrow represents the most likely mutation fixed at each development step. Antibody positions are from IMGT numbering. (C and D) Monovalent KD as a function of the number of mutations from UCA (development step). These data represent all MAGMA-seq output filtered on >250 average read counts for (C) 2–15 and (D) 002-S2F12. (E) Most likely monovalent KD as a function of development step for the seven SARS-CoV-2 antibodies considered in this study. All antibodies, except for bnAb 002-S21F2, have likely completed affinity maturation by step 2.
Fig. 4.
Fig. 4.
UCAs of subtype-specific SARS-CoV-2 antibodies have inherent affinity for antigen. (A) Mean of measured monovalent KD’s for each anti-S1 UCA antibody determined via yeast surface display titrations (KD median: 800 nM; geometric mean 622 nM). Antibodies tested: 5–7, 4A8, 2–15, COV2-2489, 2–7, CC6.31, C118, 2–17, 5–24, CC6.29, 002-S21F2, 4–8, CC12.1, 4–19. For the UCA titrations where our fitted KDs were above 1 µM with large CI for the fit, we could not report an accurate monovalent binding dissociation constant and conservatively reported as >2 µM which is highlighted in the panel with a dashed horizontal line. (B) Predicted results if the inferred UCA sequence is incorrect—the sequence would be highly improbable and have better affinity for a given antigen relative to competing sequences. (C) Antibodies tested by UCA reversion at ambiguous junction locations in the CDRH3. Single nucleotide saturation mutagenesis libraries of CDR H3 were prepared at ambiguous junction sequences (bolded and underlined). (D) MAGMA-seq is used to assess the population of different UCA sequences. The micromolar affinity of many sequences precludes quantitative KD determination. Thus, a relative binding score is calculated by transforming the individual probabilities at each S1 labeling concentration. (E) Binding scores vs. IGoR calculated generation probabilities for four different antibody libraries. Stars represent different silent mutations of inferred UCA sequence. Each panel represents a different biological replicate.
Fig. 5.
Fig. 5.
Agent-based models quantify the importance of differential affinity to GC success outcomes. All results were averaged across N = 10 immunizations of 100 GCs each (e.g., 1,000 total GC replicates per simulated condition). (A) Schematic of simulation setup whereby the affinity advantage (ΔΔG0) given to the high-affinity population (NHigh) is varied, or the initial proportion of high and/or low affinity is varied. (B) The final proportion of B cells derived from NHigh cells (NHigh,end) relative to the final total population (NTotal,end), given an initial NHigh population at the beginning of the simulation. Colors depicted in (BF) represent the affinity advantage given to NHigh cells. All x axes represent the initial proportion of NHigh cells. (C) Average initial affinity (ΔG0¯) across all germline B cells. (D) The proportion of GCs which successfully terminated the reaction (defined as the proportion of GCs which recovered their initial population). (E) Average change in affinity (ΔΔGf) after maturation across the B cell population. (F) Average SD of the resulting binding affinity (ΔGf,std) of the B cell population.

Similar articles

Cited by

  • Replaying germinal center evolution on a quantified affinity landscape.
    DeWitt WS, Vora AA, Araki T, Galloway JG, Alkutkar T, Bortolatto J, Castro TBR, Dumm W, Jennings-Shaffer C, Jia T, Mesin L, Ozorowski G, Pae J, Ralph DK, Bloom JD, Nourmohammad A, Song YS, Ward AB, Starr TN, Matsen FA 4th, Victora GD. DeWitt WS, et al. bioRxiv [Preprint]. 2025 Jun 5:2025.06.02.656870. doi: 10.1101/2025.06.02.656870. bioRxiv. 2025. PMID: 40661619 Free PMC article. Preprint.

References

    1. Graham B. S., Gilman M. S. A., McLellan J. S., Structure-based vaccine antigen design. Annu. Rev. Med. 70, 91–104 (2019). - PMC - PubMed
    1. Feng A., Hao Q., Yeap L.-S., Contribution of rare mutational outcomes to broadly neutralizing antibodies. Acta Biochim. Biophys. Sin. 54, 820–827 (2022). - PMC - PubMed
    1. McGuire A. T., et al. , HIV antibodies. Antigen modification regulates competition of broad and narrow neutralizing HIV antibodies. Science 346, 1380–1383 (2014). - PMC - PubMed
    1. Rossmann M. G., The canyon hypothesis. Viral Immunol. 2, 143–161 (1989). - PubMed
    1. Jayaram N., Bhowmick P., Martin A. C. R., Germline VH/VL pairing in antibodies. Protein Eng. Des. Sel. 25, 523–529 (2012). - PubMed

MeSH terms

Substances

LinkOut - more resources