. 2025 Jan 28;122(4):e2413351122.
doi: 10.1073/pnas.2413351122. Epub 2025 Jan 22.

Intercellular mRNA transfer alters the human pluripotent stem cell state

Affiliations

Intercellular mRNA transfer alters the human pluripotent stem cell state

Yosuke Yoneyama et al. Proc Natl Acad Sci U S A. .

Abstract

Intercellular transmission of messenger RNA (mRNA) is being explored in mammalian species using immortal cell lines. Here, we uncover an intercellular mRNA transfer phenomenon that allows for the adaptation and reprogramming of human primed pluripotent stem cells (hPSCs). This process is induced by the direct cell contact-mediated coculture with mouse embryonic stem cells under the condition impermissible for primed hPSC culture. Mouse-derived mRNA contents are transmitted into adapted hPSCs only in the coculture. Transfer-specific mRNA analysis shows the enrichment for divergent biological pathways involving transcription/translational machinery and stress-coping mechanisms, wherein such transfer is diminished when direct cell contacts are lost. After 5 d of coculture with mouse embryonic stem cells, surface marker analysis and global gene profiling confirmed that mRNA transfer-prone hPSC efficiently gains a naïve-like state. Furthermore, transfer-specific knockdown experiments targeting mouse-specific transcription factor-coding mRNAs in hPSC show that mouse-derived Tfcp2l1, Tfap2c, and Klf4 are indispensable for human naïve-like conversion. Thus, interspecies mRNA transfer triggers cellular reprogramming in mammalian cells. Our results support that episodic mRNA transfer can occur in cell cooperative and competitive processes, which provides a fresh perspective on understanding the roles of mRNA mobility for intra- and interspecies cellular communications.

Keywords: cell–cell communication; mRNA transfer; pluripotency; reprogramming.


Conflict of interest statement

Competing interests statement:The authors declare no competing interest.

Figures
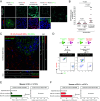
Fig. 1.
Fig. 1.
Interspecies mRNA transfer between human and mouse PSCs. (A) Representative RNAscope images of EGFP RNA in separate cultures of EGFP-expressing mESCs, and hESCs either in primed maintenance medium or in CM of the coculture, and the coculture of mouse and human ESCs. The cells were also counterstained with anti-Ku80 antibody (human nuclei) and Hoechst 33342 (all nuclei). (Scale bar, 10 μm.) (B) Quantification of the number of EGFP RNA signals in A. The randomly selected fields (n = 6 to 10) of each sample were analyzed, and the RNAscope signals in approximately 400 to 600 cells were counted (the number of cells analyzed is indicated in parentheses on the graphs). The black horizontal lines indicate the mean of the distribution. (C) Representative, confocal z-sectioned RNAscope images of the coculture of hESCs (H9 mCh-Farnersyl5) and mESCs (MS2-tagged Oct4, OM) in 2i+LIF condition. The cells were also counterstained with Hoechst 33342 (nuclei). A confocal plane (xy) and orthogonal views (xz and yz) are shown. White arrowheads indicate the presence of mouse Pou5f1 mRNA inside the human cells. (Scale bar, 10 μm.) (D) Experimental design for primed hiPSCs (GFP-positive 317D6) and naïve mESCs (tdTomato-positive J1-tdT) coculture followed by FACS. Representative FACS analyses of mixed cells were shown either from day-5 coculture (mix with coculture) or from mix on ice prior to FACS (mix w/o coculture). GFP+/tdTomato and GFP/tdTomato+ cells were sorted for the subsequent RT-qPCR analyses. (E and F) RT-qPCR analyses of mouse Actb and Neat1 RNAs in the sorted hiPSCs from mix w/o coculture, mix with coculture, or separate culture, or of human ACTB and NEAT1 RNAs in the sorted mESCs. Relative values normalized with endogenous β-actin (ACTB/Actb) expression are shown as an average ± SD from three independent experiments.
Fig. 2.
Fig. 2.
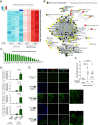
Global profiling revealed divergent mRNA transfer involving transcription factors. (A) Heatmap of differentially expressed mouse genes in hiPSCs cocultured with mESCs compared with the separate cultures of hiPSCs. The samples from two independent replicates were prepared from two hiPSC lines, 317-12 and 317D6. The top 75 genes with the highest gene expression variance across the samples were plotted. Colors represent gene expression of each sample relative to the mean. The coculture for the RNA-seq was performed in the absence of MEF feeder cells. (B) ORA of mouse genes enriched in the sorted hiPSCs after coculture with mESCs and the KEGG networks grouping these genes by the enrichment network tool NetworkAnalyst. The functionally grouped network was visualized based on the degree of connectivity between pathways and genes (nodes). The pathway nodes are colored according to P-value of ORA, while the size of the nodes corresponds to the number of genes from the analyzed gene list. The smaller nodes correspond to individual genes, colored according to their fold change. (C) Expression levels (read counts in RNA-seq) of the selected mouse transcripts related to pluripotency in hiPSCs after cocultured with mESCs. Average ± SD is shown. (D) RT-qPCR analyses of mouse Tfcp2l1, Nanog, Klf4, and Tfap2c mRNAs in the sorted hiPSCs from mix w/o coculture, mix with coculture, or separate culture. Relative values normalized with endogenous ACTB expression are shown as an average ± SD from three independent experiments. (E) Representative RNAscope images of MS2-tagged RNA in separate cultures of EGFP-expressing hiPSCs (317D6) in primed maintenance medium, and MS2-tagged Nanog (NM)- or MS2-tagged Oct4 (OM)-expressing mESCs in 2i+LIF, and in the coculture of hiPSCs and mESCs. The cells were also counterstained with anti-Ku80 antibody (human nuclei) and Hoechst 33342 (all nuclei). (Scale bar, 10 μm.) (F) Quantification of the number of MS2 probe-positive RNA spots in E. The randomly selected fields (n = 6 to 12) of each sample were analyzed for the RNAscope spots in over 500 cells. The black horizontal lines indicate the mean of the distribution.
Fig. 3.
Fig. 3.
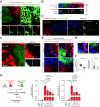
mRNA-containing membrane protrusions from mouse to human cells are required for mRNA transfer. (A) Coculture of H9 mCherry-Farnesyl5 (red) hESCs and G4-2 GFP (green)-expressing mESCs stained with F-actin (cyan) and membrane (yellow) specific dyes. Top images are maximum projection of z-stacked images (Scale bar, 10 μm.) Bottom images are from a confocal plane of a magnified region containing membrane protrusions (Scale bar, 10 μm.) Arrows indicate representative membrane protrusions connecting hESCs and mESCs. (B) Representative, enlarged image from Fig. 3A showing the interconnected membrane bridges that were formed above the substratum. Top image is a maximum projection of z-stacked images while bottom orthogonal views (xy). (Scale bar, 10 μm.) (C) Representative confocal images of EGFP RNA (white) in the coculture of H9 mCherry-Farnesyl5 (red) hESCs and G4-2 GFP (green)-expressing mESCs visualized by RNAscope (Scale bar, 10 μm.) The area indicated by the dashed box is also magnified in the Right panels. (D) Representative confocal images of MS2-tagged Pou5f1 RNA (green) in the coculture of H9 mCherry-Farnesyl5 (red) hESCs and Oct4-MS2 mESCs visualized by RNAscope (Scale bar, 10 μm.) The images are captured near the bottom of the culture. The area indicated by the dashed box is also magnified in the Right panels. (E and E’) Maximum projection images of the coculture of H9 mCherry-Farnesyl5 (red) hESCs and G4-2 GFP (green)-expressing mESCs treated either with control or with L-778123 (0.5 μM). The cells were counterstained with F-actin-specific dye (blue) (E, Scale bar, 10 μm.) The area indicated by the dashed box is also magnified in E’ as a confocal plane (Scale bar, 5 μm.) (F) Quantification of the number (Left) and the length (Right) of membrane connections observed between hESCs and mESCs in the presence or absence of L-778123. (G) Experimental design for primed H9 hESCs (mCherry-positive) and naïve G4-2 mESCs (GFP-positive) coculture in the presence of L-778123 followed by FACS sorting of mCherry-positive fraction (Left, also see SI Appendix, Fig. S5B). RT-qPCR analyses of mouse Actb and Nanog RNAs in the sorted hESCs from mix with coculture conditions treated with the indicated concentrations of L-778123. The separate culture as well as mix w/o coculture was set as control. Relative values normalized with endogenous human ACTB expression are shown as an average ± SD from three to four independent experiments (right bar graphs).
Fig. 4.
Fig. 4.
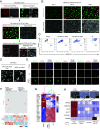
Interspecies coculture with mouse ESCs enables naïve-like conversion of human PSCs. (A) Protocols for coculture of primed hPSCs (H9 human ESCs expressing a membrane reporter mCherry-Farnesyl5) and naïve mESCs (G4-2 mouse ESCs expressing GFP). Both cell types (50% each) were cocultured in 2i+LIF condition for 5 d followed by sorting human cells. The sorted human cells were further cultured in PXGL condition, representing the morphological conversion into dome-shaped colonies (white arrowheads). (Scale bar, 100 μm.) (B) Representative images captured at the indicated time points during the coculture of primed hPSCs (H9, red) and naïve mESCs (G4-2, green). (Scale bar, 100 μm.) (C) Flow cytometry analysis using naïve-specific SUSD2 antibody in H9 hESCs (expressing mCherry) that were separately cultured in a primed state (primed) or 2i+LIF followed by culture in PXGL (w/o mESC coculture), or cocultured with mouse ESCs in 2i+LIF followed by human cell sorting and culture in PXGL (with mESC coculture). The cR cells derived from the same H9 cells were also included. (D) Phase-contrast images in H9 hESCs that were converted into cR cells (Left) or expanded after sorting SUSD2+ cells from the cocultured H9 cells with mESCs (Right). (Scale bar, 100 μm.) (E) Immunostaining images of human naïve pluripotency markers KLF4, KLF17, and TFCP2L1 together with human-specific nuclear antigen (HuNu) in parental primed hiPSCs (Upper), cR cells (Middle), and SUSD2+-sorted human cells cocultured with mESCs (Bottom). (Scale bar, 20 μm.) (F) Principal-component analysis (PCA) was performed on RNA-seq measurement obtained from hiPSCs, including primed cells (parental), cR cells, and converted cells via mESC coculture and subsequent expansion. The data were clustered with previous, independently generated RNA-seq of hESCs in primed and cR states (both on-feeder and feeder-free) (33). (G) Unbiased hierarchical clustering of samples represented in F. The expression levels of selected naïve and primed pluripotency marker genes are shown. (H) Expression heatmap of selected naïve and primed pluripotency markers in hiPSCs, including direct coculture with mESC, CM from mESCs, transwell coculture, and primed cells. The representative images of each condition are shown (Top, Scale bar, 100 μm.) RT-qPCR analyzed the relative expression levels of each gene from three independent experiments.
Fig. 5.
Fig. 5.
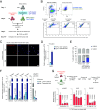
mRNA transfer-prone human PSCs efficiently convert into naïve-like state. (A) Experimental design for tracing a reporter mRNA transfected in mESCs during the coculture in 2i+LIF condition. In vitro transcribed, Cy5-labeled GFP mRNA was transfected in mESCs 1 d before the start of coculture with primed hESCs (mCherry-positive). Day 5 post coculture, mCherry-positive human cells were sorted into either Cy5-positive or -negative fraction. (B) Representative FACS analyses of the coculture at day 5. In mCherry-negative fraction, both Cy5 and GFP signals were higher in the coculture with Cy5-GFP mRNA transfected mESCs compared to that with nontransfected mESCs (Top). To gate the Cy5-positive human cells, coculture condition with nontransfected mESCs as well as one without mESCs (hESC only) was set as controls (Bottom). (C) Expansion of Cy5-positive and -negative hESCs (mCherry-positive) in PXGL medium after isolation from coculture with Cy5-GFP mRNA transfected mESCs. (Scale bar, 200 μm.) (D) RT-qPCR analysis of a proliferation marker MKI67 of the cells in C. Average ± SD is shown from three independent experiments. (E) Flow cytometry analysis of a naïve PSC surface marker SUSD2 of the cells in C. Primed hESCs were set as a control. Average of SUSD2 positivity ± SD is shown from three independent experiments. (F) RT-qPCR analyses of naïve or primed marker genes expressed in the cells in C. Primed hESCs were set as a control. Relative values normalized with endogenous ACTB expression are shown as an average ± SD from three independent experiments. (G) Experimental design for primed H9 hESCs (mCherry-positive) and naïve G4-2 mESCs (GFP-positive) coculture in the presence of L-778123 followed by FACS sorting of mCherry-positive fraction and expansion in PXGL medium (Top). RT-qPCR analyses of NANOG, KLF4, and TFAP2C expression in the expanded hESCs from mESC coculture. Relative values normalized with endogenous ACTB expression are shown as an average ± SD from three independent experiments (Bottom).
Fig. 6.
Fig. 6.
Pioneer transcription factor mRNA transfer is indispensable for naïve-like conversion of hiPSCs. (A) Protocols for coculture of primed hiPSCs expressing Venus and shRNA specifically targeting each mouse transcription factor (puromycin-resistant) with naïve mESCs (puromycin-sensitive) followed by the induction of naïve-like conversion. After the coculture of both cell types (50% each) in 2i+LIF condition for 5 d, they were passed onto the puromycin-resistant feeder cells in the presence of puromycin in PXGL medium to eliminate mESCs. After the puromycin selection, the residual human cells were subsequently analyzed. (B) RT-qPCR analysis to validate the target species specific of the designed shRNA. The graphs show endogenous KLF4, TFCP2L1, TFAP2C, NANOG, and POU5F1 gene expression levels in hiPSCs (Right) as well as Klf4, Tfcp2l1, Tfap2c, Nanog, and Pou5f1 gene expression levels in mESCs (Left) in which lentiviral shRNAs targeting mouse Klf4, Tfcp2l1, Tfap2c, Nanog, or Pou5f1 designed in SI Appendix, Fig. S11A were expressed. Average ± SD (n = 3) is shown. (C) The emerging colonies of dome-shaped, human cells expressing control luciferase shRNA (shLuc) emerging after puromycin selection are shown (white arrowheads in the left image; Scale bar, 100 μm.) The number of Venus-positive, dome-shaped colonies emerging after the puromycin selection in each shRNA expression condition was shown in the box and whiskers plot (Right; bars represent min to max of the counts). The randomly selected fields (in 10 mm2 area, n = 32) of each sample from two independent experiments were analyzed. (D) Immunostaining images of human naïve pluripotency marker KLF17 in Venus-positive hiPSCs expressing shRNAs targeting luciferase (shLuc) or mouse Klf4, Tfcp2l1, and Tfap2c after the coculture with mESCs followed by puromycin selection. (Scale bar, 50 μm.)

Update of

Similar articles

Cited by

References

    1. O’Brien K., Breyne K., Ughetto S., Laurent L. C., Breakefield X. O., RNA delivery by extracellular vesicles in mammalian cells and its applications. Nat. Rev. Mol. Cell Biol. 21, 585–606 (2020). - PMC - PubMed
    1. Nawaz M., Fatima F., Extracellular vesicles, tunneling nanotubes, and cellular interplay: Synergies and missing links. Front. Mol. Biosci. 4, 50 (2017). - PMC - PubMed
    1. Lai C. P., et al. , Visualization and tracking of tumour extracellular vesicle delivery and RNA translation using multiplexed reporters. Nat. Commun. 6, 7029 (2015). - PMC - PubMed
    1. Valadi H., et al. , Exosome-mediated transfer of mRNAs and microRNAs is a novel mechanism of genetic exchange between cells. Nat. Cell Biol. 9, 654–659 (2007). - PubMed
    1. Jiang H., Li Z., Li X., Xia J., Intercellular transfer of messenger RNAs in multiorgan tumorigenesis by tumor cell-derived exosomes. Mol. Med. Rep. 11, 4657–4663 (2015). - PubMed

LinkOut - more resources