. 2025 Jan 22;23(2):11.
doi: 10.1007/s12021-024-09703-4.

Blood Flow Velocity Analysis in Cerebral Perforating Arteries on 7T 2D Phase Contrast MRI with an Open-Source Software Tool (SELMA)

Affiliations

Blood Flow Velocity Analysis in Cerebral Perforating Arteries on 7T 2D Phase Contrast MRI with an Open-Source Software Tool (SELMA)

S D T Pham et al. Neuroinformatics. .

Abstract

Blood flow velocity in the cerebral perforating arteries can be quantified in a two-dimensional plane with phase contrast magnetic imaging (2D PC-MRI). The velocity pulsatility index (PI) can inform on the stiffness of these perforating arteries, which is related to several cerebrovascular diseases. Currently, there is no open-source analysis tool for 2D PC-MRI data from these small vessels, impeding the usage of these measurements. In this study we present the Small vessEL MArker (SELMA) analysis software as a novel, user-friendly, open-source tool for velocity analysis in cerebral perforating arteries. The implementation of the analysis algorithm in SELMA was validated against previously published data with a Bland-Altman analysis. The inter-rater reliability of SELMA was assessed on PC-MRI data of sixty participants from three MRI vendors between eight different sites. The mean velocity (vmean) and velocity PI of SELMA was very similar to the original results (vmean: mean difference ± standard deviation: 0.1 ± 0.8 cm/s; velocity PI: mean difference ± standard deviation: 0.01 ± 0.1) despite the slightly higher number of detected vessels in SELMA (Ndetected: mean difference ± standard deviation: 4 ± 9 vessels), which can be explained by the vessel selection paradigm of SELMA. The Dice Similarity Coefficient of drawn regions of interest between two operators using SELMA was 0.91 (range 0.69-0.95) and the overall intra-class coefficient for Ndetected, vmean, and velocity PI were 0.92, 0.84, and 0.85, respectively. The differences in the outcome measures was higher between sites than vendors, indicating the challenges in harmonizing the 2D PC-MRI sequence even across sites with the same vendor. We show that SELMA is a consistent and user-friendly analysis tool for small cerebral vessels.

Keywords: 2D PC-MRI; Analysis tool; Blood flow velocity; Perforating arteries; Pulsatility index.


Conflict of interest statement

Declarations. Competing Interests: The authors declare no competing interests.

Figures
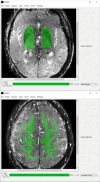
Fig. 1
Fig. 1
The graphical user interface of SELMA after analysis has been completed in the basal ganglia (top) or center semioval (bottom). Slice selection can be performed in the bottom right. Note that it is important to verify that the correct slice is selected as that will change certain algorithm parameters. Analysis is initiated by either manually drawing or loading in a pre-defined region of interest (ROI) such as a white matter mask. ROIs can be directly drawn in SELMA and saved for further analysis. After completion, SELMA will highlight detected vessels in blue and automatically produce an output file containing the outcome measurements for every vessel and averaged over all vessels. SELMA settings can be accessed in the top bar of the GUI
Fig. 2
Fig. 2
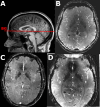
A) The two dimensional phase contrast (2D PC) acquisition was planned on a 3D anatomic image (T1) at the level of the basal ganglia. Images B, C and D show representative magnitude scans of the basal ganglia in three different subjects for vendor 1, 2, and 3 respectively. To achieve the same spatial resolution across vendors, the image in panel D was acquired with a smaller field-of-view due to setting limitations in the acquisition matrix size. The unavoidable aliasing in the anterior–posterior direction does not affect the analysis in the region of interest
Fig. 3
Fig. 3
The scatterplots on the left show the relation between age and Ndetected (A), vmean (C), and PI (E) respectively. The plots on the right show the differences between females and males for Ndetected (B), vmean (D), and PI (F) respectively (8 plots for the 8 sites). The different shapes and colors in the plots represent the different vendors and sites respectively. The regression coefficient with respective 95% confidence interval and p-value is shown under each plot for each linear mixed model with age or gender and the outcome measures, including site and vendor as co-variates. Regression coefficients for age are given per year and for gender with female as reference (i.e. female = 0, male = 1). Ndetected = number of detected arteries; vmean = mean blood flow velocity of the perforating arteries given in cm/s; PI = pulsatility index

Similar articles

Cited by

References

    1. Aribisala, B. S., Morris, Z., Eadie, E., Thomas, A., Gow, A., Valdés Hernández, M. C., et al. (2014). Blood pressure, internal carotid artery flow parameters, and age-related white matter hyperintensities. Hypertension,63, 1011–1018. - PMC - PubMed
    1. Arts, T., Siero, J. C. W., Biessels, G. J., & Zwanenburg, J. J. M. (2021). Automated assessment of cerebral arterial perforator function on 7t mri. Journal of Magnetic Resonance Imaging,53, 234–241. - PMC - PubMed
    1. Arts, T., Meijs, T. A., Grotenhuis, H., Voskuil, M., Siero, J., Biessels, G. J., et al. (2021). Velocity and pulsatility measures in the perforating arteries of the basal ganglia at 3t mri in reference to 7t mri. Frontiers in Neuroscience,15, 665480. - PMC - PubMed
    1. Birnefeld, J., Wåhlin, A., Eklund, A., & Malm, J. (2020). Cerebral arterial pulsatility is associated with features of small vessel disease in patients with acute stroke and tia: A 4d flow mri study. Journal of Neurology.,267, 721–730. - PMC - PubMed
    1. Björnfot, C., Eklund, A., Larsson, J., Hansson, W., Birnefeld, J., Garpebring, A., et al. (2024). Cerebral arterial stiffness is linked to white matter hyperintensities and perivascular spaces in older adults – a 4d flow mri study. Journal of Cerebral Blood Flow & Metabolism.,44, 1343–1351. - PMC - PubMed