. 2024 Nov 22;26(1):bbaf021.
doi: 10.1093/bib/bbaf021.

Spatially aligned graph transfer learning for characterizing spatial regulatory heterogeneity

Affiliations

Spatially aligned graph transfer learning for characterizing spatial regulatory heterogeneity

Wendong Huang et al. Brief Bioinform. .

Abstract

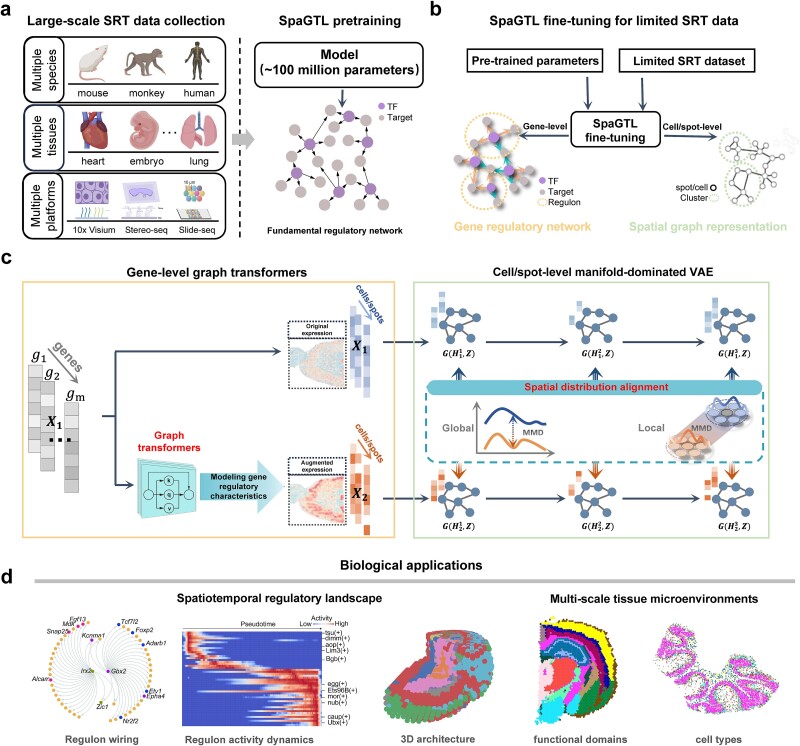
Spatially resolved transcriptomics (SRT) technologies facilitate the exploration of cell fates or states within tissue microenvironments. Despite these advances, the field has not adequately addressed the regulatory heterogeneity influenced by microenvironmental factors. Here, we propose a novel Spatially Aligned Graph Transfer Learning (SpaGTL), pretrained on a large-scale multi-modal SRT data of about 100 million cells/spots to enable inference of context-specific spatial gene regulatory networks across multiple scales in data-limited settings. As a novel cross-dimensional transfer learning architecture, SpaGTL aligns spatial graph representations across gene-level graph transformers and cell/spot-level manifold-dominated variational autoencoder. This alignment facilitates the exploration of microenvironmental variations in cell types and functional domains from a molecular regulatory perspective, all within a self-supervised framework. We verified SpaGTL's precision, robustness, and speed over existing state-of-the-art algorithms and show SpaGTL's potential that facilitates the discovery of novel regulatory programs that exhibit strong associations with tissue functional regions and cell types. Importantly, SpaGTL could be extended to process multi-slice SRT data and map molecular regulatory landscape associated with three-dimensional spatial-temporal changes during development.

Keywords: cross-dimensional transfer learning; graph transformers; spatial regulatory network inference; spatially resolved transcriptomics.


Figures

Figure 1
Figure 1
The schematic overview of SpaGTL. (a) a large-scale SRT data collection with 96 million spots/cells, spanning from different species, tissues and platforms, was used for pretraining the model and generating a fundamental GRN. (b) the fine-tuning on specific SRT datasets, with copying pretrained attention weights as the initial values, can be used for inference of context-specific regulatory networks resolving heterogeneous spatial microenvironments at different scales. (c) Outline of the core architecture. Original gene expression matrix serves as the initial training data (i.e. X1). Augmented expression matrix (i.e. X2) is generated through a graph-transformer block, which reconstructs expression values from potential regulated genes based on attention weight. In encoder-decoder, the alignment strategy constrains the learnable manifold structure (i.e. Z) in representation learning, which aligns global distributions from original and augmented views as well as their spatially local distributions over all hidden layers. (d) Biological applications for specific fine-tuning datasets, including regulon (i.e. regulatory module) inference, spatiotemporal regulatory heterogeneity analysis, functional domain detection, and cell type identification. 3D, three-dimensional; MMD, maximum mean discrepancy; TF, transcriptional factor.
Figure 2
Figure 2
Benchmarking of fine-tuning SpaGTL against existing GRN inference methods. (a) Simulation data generation process. The process initiates with the generation of expression data at single-cell resolution using the BoolODE model. Then, this data is projected into t-distributed stochastic neighbor embedding (t-SNE) space [69], where several proximal cells in the embeddings are binned into a spot. (b) Evaluations of regulatory network inference accuracy. This panel shows the area under the receiver operating characteristic (AUROC) and area under the precision-recall curve (AUPRC), calculated between the inferred results and the ground-truth networks. Each method was applied 50 times to each dataset. (c) Method stability comparison. This panel compares the consistency of predicted outcomes from each method across the 50 repeated trials. Metrics used include Spearman coefficient and Jaccard coefficient. PIDC, scSGL, and hotspot, three methods that do not involve stochastic processes are excluded from this comparison. (d) Computational efficiency comparison. The comparison assesses the impact of both gene and spot quantities on the computational efficiency of the methods.
Figure 3
Figure 3
Exploration of domain-level regulatory patterns on 10X Visium mouse brain coronal data. (a) the clustering identified from fine-tuning SpaGTL is annotated based on the Allen brain reference atlas anatomical diagram. (b) Regulon activity heatmap. Each column presents a spatial domain as annotated in (a) and each row corresponds to a regulon which is denoted by its transcriptional factor, e.g. transcriptional factor(+). (c) Regulon pattern comparison analysis. For each marker regulon, log2FC (log2 fold change) is used to assess its activity specificity against all the other regions, and Moran’s I statistic is employed to measure its spatial continuity within the focused domain. (d) Illustration of representative marker regulons. The corresponding domains are shown on the left, and on the right, display the in situ staining activities of the marker regulons from SpaGTL, GRNboost2, and DeepSEM, presented sequentially. (e) Barplots for quantifying the patterns of the selected marker regulons from (d). A bar is replaced as “undetected” if the method did not infer this regulon. (f) Network topologies of Irx2(+) and Gbx2(+) regulons.
Figure 4
Figure 4
Investigating regulatory patterns among different cell types through slide-seqV2 mouse cerebellum dataset. (a) SpaGTL’s clustering on slide-seqV2 data is annotated based on single-cell marker genes [11]. (b) Regulon activity heatmap. (c) Regulon pattern comparison analysis on cell-type marker regulons from the inferred outcomes by each method. (d) Spatial patterns of the selected marker regulons or corresponding TFs. These ISH data are obtained from Allen’s brain atlas. (e) Barplots for quantifying the regulatory patterns of the selected marker regulons from (d). (f) the network topologies of Sox9(+) and Mef2c(+) regulons. Astro, astrocytes; Bergm, Bergmann; Granu, granule; MLI1, molecular layer interneurons 1; MLI2, molecular layer interneurons 2; oligo, oligodendrocytes; Purki, Purkinje.
Figure 5
Figure 5
Exploration of spatiotemporal regulatory patterns on stereo-seq drosophila 3D data. (a) Data collection overview. Five multi-slice datasets encompass drosophila embryonic (i.e. E14 and E16) and larval (i.e. L1, L2, and L3) stages with the domain-level annotations provided originally [28]. (b, c) AUROC, Moran’s I, and Log2FC values are calculated to assess the prediction outcomes from different methods. (d) Spatial activity patterns of representative marker regulons detected by different inference methods for various embryonic structures. (e) Annotation and RNA velocity analysis of the testis from L3 transverse section. (f) Regulon activity patterns along the spatiotemporal axis. (g) Spatiotemporal patterns of egg(+) and aop(+).A–P, anterior–posterior; C, somatic cyst cells; EPS, early primary spermatocytes; G, spermatogonia; LPS, late primary spermatocytes; P, pigment cells; T, terminal epithelium precursor cells.

Similar articles

Cited by

References

    1. Almet AA, Cang Z, Jin S. et al. . The landscape of cell–cell communication through single-cell transcriptomics. Curr Opin Syst Biol 2021;26:12–23. 10.1016/j.coisb.2021.03.007. - DOI - PMC - PubMed
    1. Ståhl PL, Salmén F, Vickovic S. et al. . Visualization and analysis of gene expression in tissue sections by spatial transcriptomics. Science 2016;353:78–82. 10.1126/science.aaf2403. - DOI - PubMed
    1. Stickels RR, Murray E, Kumar P. et al. . Highly sensitive spatial transcriptomics at near-cellular resolution with slide-seqV2. Nat Biotechnol 2021;39:313–9. 10.1038/s41587-020-0739-1. - DOI - PMC - PubMed
    1. Chen A, Liao S, Cheng M. et al. . Spatiotemporal transcriptomic atlas of mouse organogenesis using DNA nanoball-patterned arrays. Cell 2022;185:e1721. - PubMed
    1. Wang L, Bai X, Zhang C. et al. . Spatially aware domain adaptation enables cell type deconvolution from multi-modal spatially resolved transcriptomics. Small Methods 2024;12:2401163. 10.1186/s12891-024-08136-z. - DOI - PubMed