. 2025 Jan 22;20(1):e0317218.
doi: 10.1371/journal.pone.0317218. eCollection 2025.

Optimal sigmoid function models for analysis of transspinal evoked potential recruitment curves recorded from different muscles

Affiliations

Optimal sigmoid function models for analysis of transspinal evoked potential recruitment curves recorded from different muscles

Andreas Skiadopoulos et al. PLoS One. .

Abstract

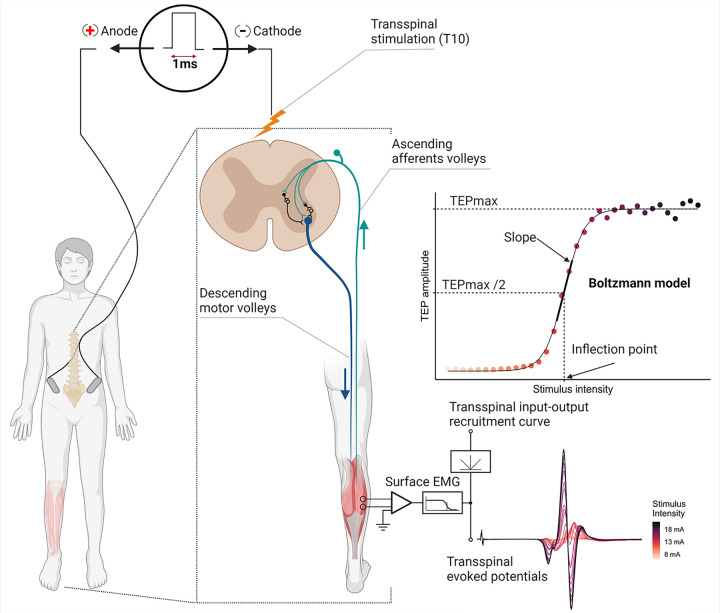
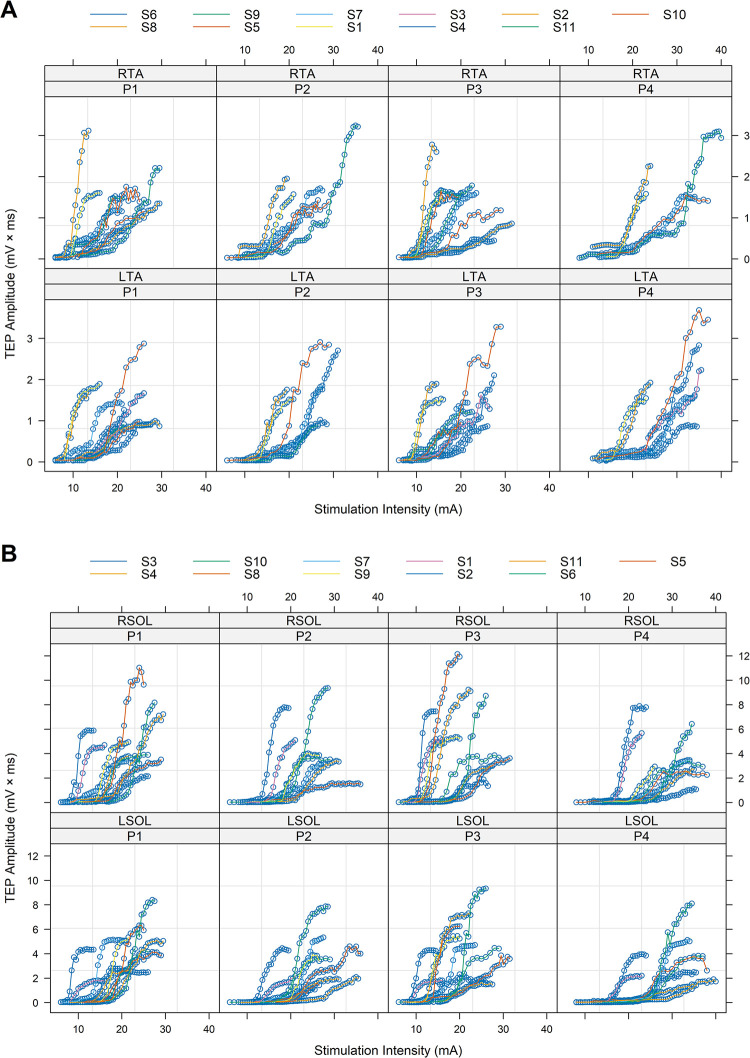
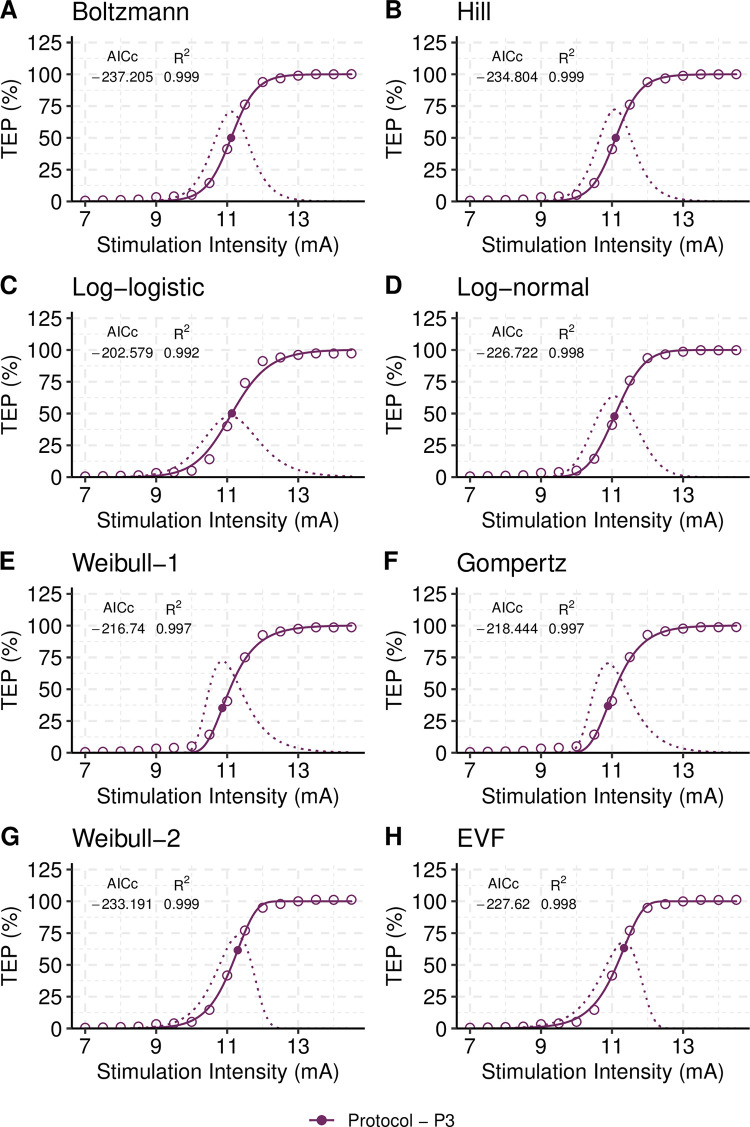
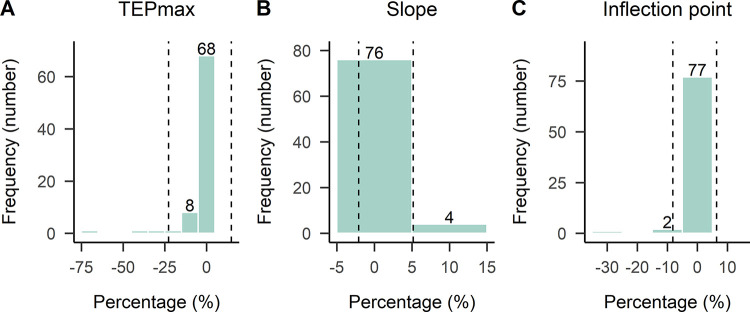
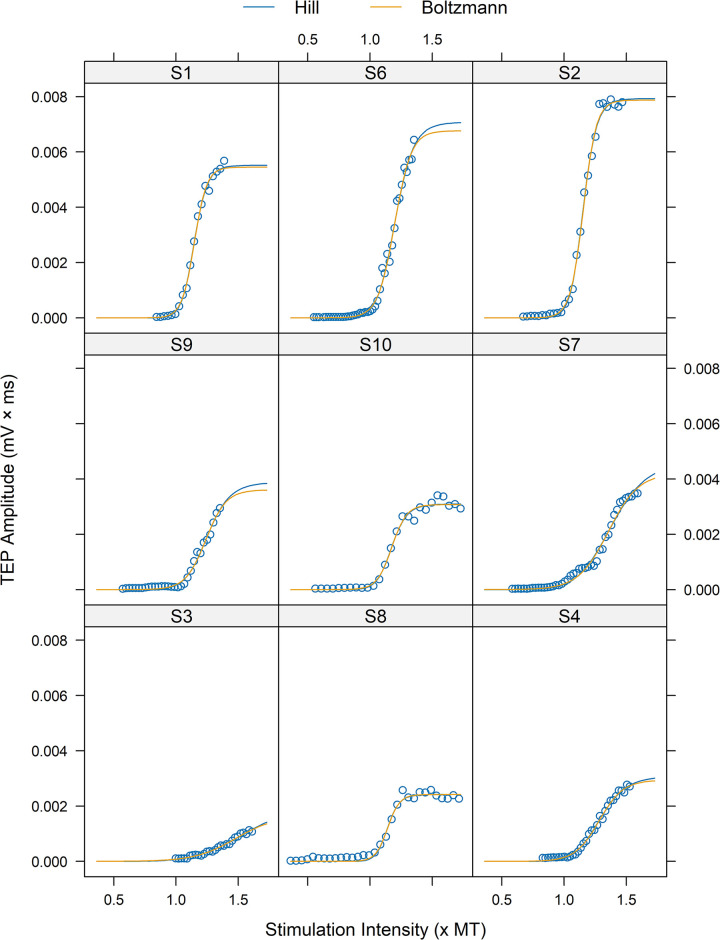
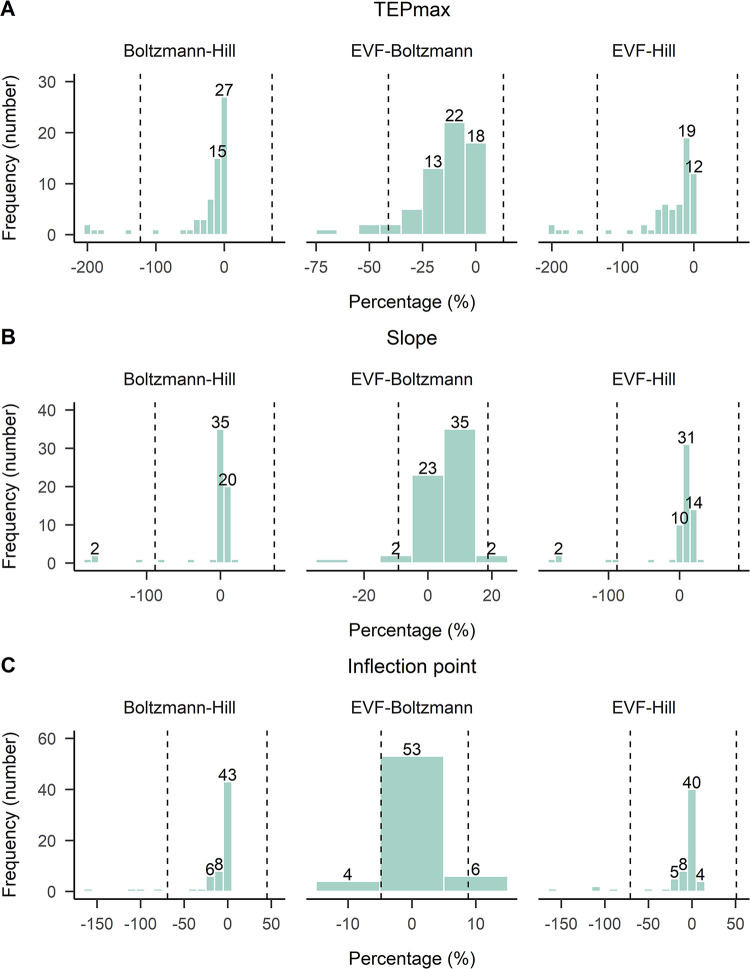
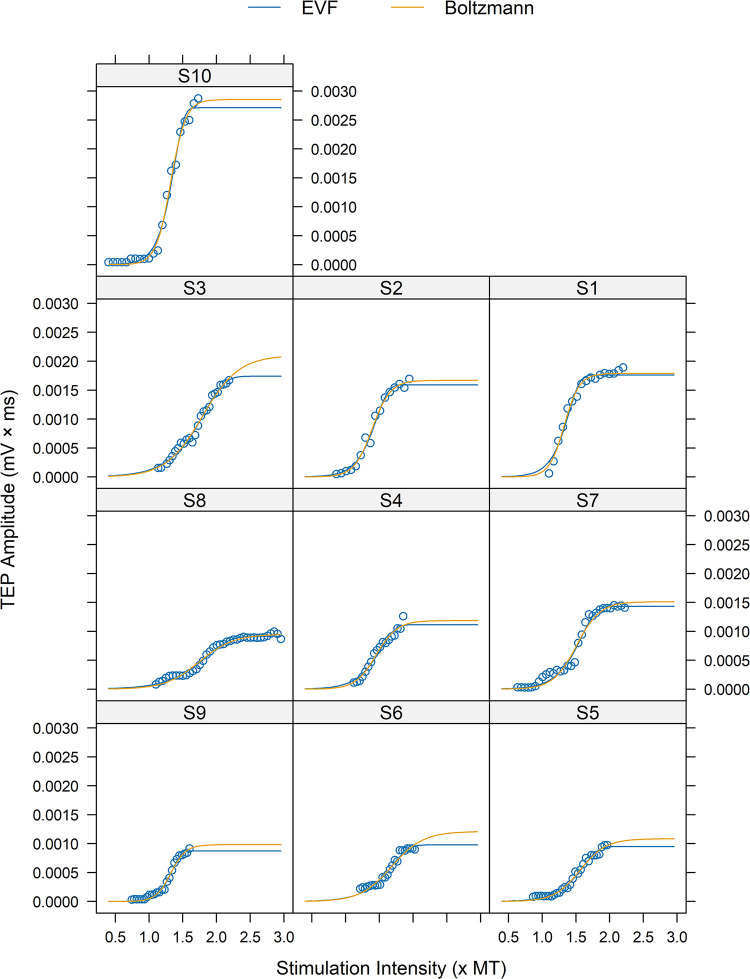
Recruitment input-output curves of transspinal evoked potentials that represent the net output of spinal neuronal networks during which cortical, spinal and peripheral inputs are integrated as well as motor evoked potentials and H-reflexes are used extensively in research as neurophysiological biomarkers to establish physiological or pathological motor behavior and post-treatment recovery. A comparison between different sigmoidal models to fit the transspinal evoked potentials recruitment curve and estimate the parameters of physiological importance has not been performed. This study sought to address this gap by fitting eight sigmoidal models (Boltzmann, Hill, Log-Logistic, Log-Normal, Weibull-1, Weibull-2, Gompertz, Extreme Value Function) to the transspinal evoked potentials recruitment curves of soleus and tibialis anterior recorded under four different cathodal stimulation settings. The sigmoidal models were ranked based on the Akaike information criterion, and their performance was assessed in terms of Akaike differences and weights values. Additionally, an interclass correlation coefficient between the predicted parameters derived from the best models fitted to the recruitment curves was also established. A Bland-Altman analysis was conducted to evaluate the agreement between the predicted parameters from the best models. The findings revealed a muscle dependency, with the Boltzmann and Hill models identified as the best fits for the soleus, while the Extreme Value Function and Boltzmann models were optimal for the tibialis anterior transspinal evoked potentials recruitment curves. Excellent agreement for the upper asymptote, slope, and inflection point parameters was found between Boltzmann and Hill models for the soleus, and for the slope and inflection point parameters between Extreme Value Function and Boltzmann models for the tibialis anterior. Notably, the Boltzmann model for soleus and the Extreme Value Function model for tibialis anterior exhibited less susceptibility to inaccuracies in estimated parameters. Based on these findings, we suggest the Boltzmann and the Extreme Value Function models for fitting the soleus and the tibialis anterior transspinal evoked potentials recruitment curve, respectively.


Conflict of interest statement

The authors have declared that no competing interests exist.

Figures

Fig 1
Fig 1. Schematic illustration of transspinal stimulation.
Example of recordings and recruitment of transspinal evoked potentials (TEPs) when delivering a single pulse of transspinal stimulation with increasing intensity. To quantify each muscle’s transspinal input-output recruitment curve, the TEP amplitude (area under curve) was plotted as a function of the stimulus intensity and a nonlinear regression model was fitted to the data (created with BioRender.com).
Fig 2
Fig 2. TEP recruitment curves.
Right and left TA (A) and SOL (B) transspinal evoked potentials (TEPs) input-output curves assembled for each subject and stimulation protocol. Points corresponding to data from the same subject are connected by lines. Within- and between-subject variability in stimulation intensities required to reach the same level of TEP amplitude, TEP threshold, maximum TEP amplitude, and the intensity required to reach maximal amplitudes are evident. RTA = right tibialis anterior; LTA = left tibialis anterior; RSOL = right soleus; LSOL = left soleus; P1, P2, P3, P4 = stimulation protocols. Each sigmoid fitting is color coded for each subject.
Fig 3
Fig 3. Modelling the TEP recruitment curve of a representative single subject.
Each plot (A-H) contains the stimulation-response data (circles), the predictions obtained from the fitted models, and the amount-of-change curve (bell-shaped curve). The stimulation intensity corresponding to the peak of the amount-of-change curve corresponds to that of the inflection point of the fitted model (showed with a filled circle on each curve). AICc and R2 values are presented alongside the plots to assess goodness-of-fit. The Boltzmann model is the best model in terms of Kullback-Leibler discrepancy (AICc = -237.205). The R2 value was found to be the same for all models, rendering it unreliable for model selection. To ensure comparability, the fitted curves were rescaled to the maximum predicted value of each model, ranging from 0% to 100%. The data is for transspinal evoked potentials (TEPs) of the right SOL from a single subject under protocol P3.
Fig 4
Fig 4. Frequency distribution of percent differences between parameters of best-fit SOL TEP recruitment curve models.
TEPmax, slope, and inflection point parameters estimated with the Boltzmann and Hill models fitted to right and left SOL TEP recruitment curves (100 × (Boltzmann—Hill) / (Boltzmann + Hill) / 2). The negative value in the percentage difference indicates that the estimated parameter was larger for Hill model compared to Boltzmann model. Values in abscissa refer to the number of TEP recruitment curves. Vertical dashed lines correspond to limits of agreement band (mean difference ± 1.96 × standard deviation).
Fig 5
Fig 5. Modelling of SOL TEP recruitment curves using Boltzmann and Hill models.
To ensure comparability between curves of different subjects, the units of the X-axis were converted by expressing the stimulation intensity values as multiples of the threshold value (× MT) derived from Boltzmann model. The Hill model did not catch the upper limits well, especially in subjects S6 and S9, resulting in higher TEPmax values than that estimated by the Boltzmann model. The data is for transspinal evoked potentials (TEPs) of the right SOL under protocol P4. For the Boltzmann model, the TEP threshold (BTH) is calculated as Φ22.944Φ3, while for the Hill model, the TEP threshold (HTH) is calculated as Φ2×e2.944Φ3.
Fig 6
Fig 6. Frequency distribution of percent differences between parameters of best-fit TA TEP recruitment curve models.
TEPmax, slope, and inflection point parameters estimated with the EVF, Boltzmann and Hill models fitted to the right and left TA TEP recruitment curves (100 × (model A—model B) / (model A + model B) / 2). The negative value in the percentage difference indicates that the estimated parameter was larger for model B compared to model A (model A–model B). Values in abscissa refer to the number of TEP recruitment curves. Vertical dashed lines correspond to limits of agreement band (mean difference ± 1.96 × standard deviation).
Fig 7
Fig 7. Modelling of TA TEP recruitment curves using EVF and Boltzmann models.
To ensure comparability between models, the units of the X-axis were converted by expressing the stimulation intensity values as multiples of the threshold value (× MT) derived from Boltzmann model. The Boltzmann model did not catch the upper limit well, especially in subjects S3 and S6, resulting in a higher TEPmax values than that of the EVF model. The data is for transspinal evoked potentials (TEPs) of the left TA under protocol P1. For the Boltzmann model, the TEP threshold (BTH) is calculated as Φ22.944Φ3, while for the EVF model, the TEP threshold (ETH) is calculated as Φ2+2.97Φ3.

Similar articles

References

    1. Carroll TJ, Riek S, Carson RG. Reliability of the input–output properties of the cortico-spinal pathway obtained from transcranial magnetic and electrical stimulation. J Neurosci Methods. 2001;112: 193–202. doi: 10.1016/s0165-0270(01)00468-x - DOI - PubMed
    1. Devanne H, Lavoie BA, Capaday C. Input-output properties and gain changes in the human corticospinal pathway. Exp Brain Res. 1997;114: 329–338. doi: 10.1007/pl00005641 - DOI - PubMed
    1. Klimstra M, Zehr EP. A sigmoid function is the best fit for the ascending limb of the Hoffmann reflex recruitment curve. Exp Brain Res. 2008;186: 93–105. doi: 10.1007/s00221-007-1207-6 - DOI - PubMed
    1. Malloy DC, Knikou M, Côté M-P. Adapting human-based transcutaneous spinal cord stimulation to develop a clinically relevant animal model. J Clin Med. 2022;11: 2023. doi: 10.3390/jcm11072023 - DOI - PMC - PubMed
    1. Pierrot-Deseilligny E, Mazevet D. The monosynaptic reflex: a tool to investigate motor control in humans. Interest and limits. Neurophysiol Clin Neurophysiol. 2000;30: 67–80. doi: 10.1016/s0987-7053(00)00062-9 - DOI - PubMed

LinkOut - more resources