. 2025 Jan 22;21(1):e1012878.
doi: 10.1371/journal.ppat.1012878. eCollection 2025 Jan.

Administration of antigenically distinct influenza viral particle combinations as an influenza vaccine strategy

Affiliations

Administration of antigenically distinct influenza viral particle combinations as an influenza vaccine strategy

Xinyu Zhu et al. PLoS Pathog. .

Abstract

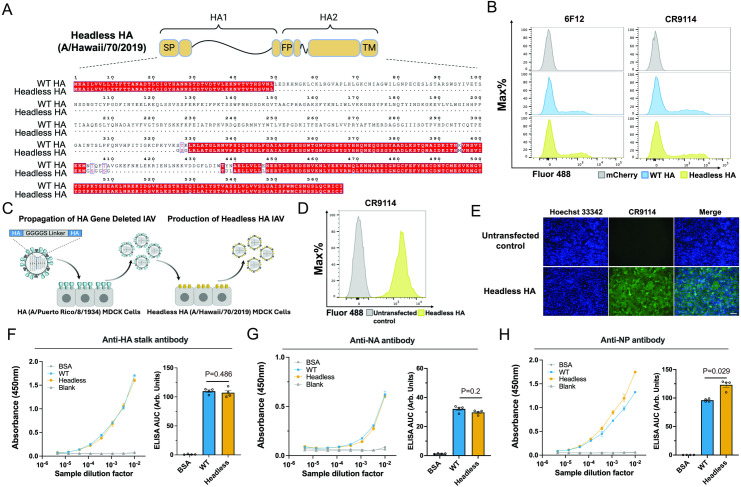
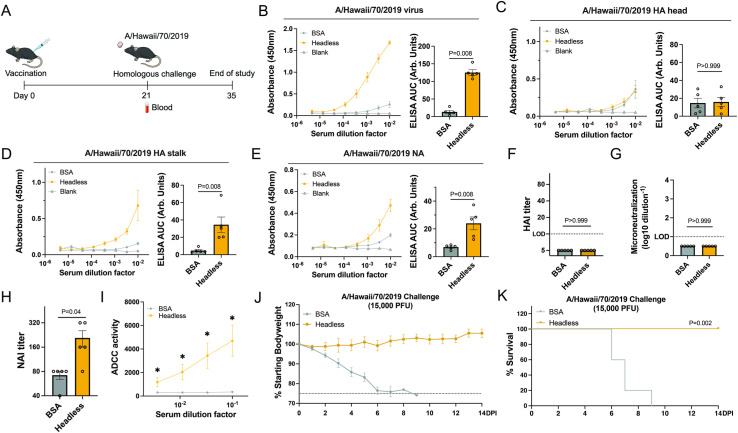
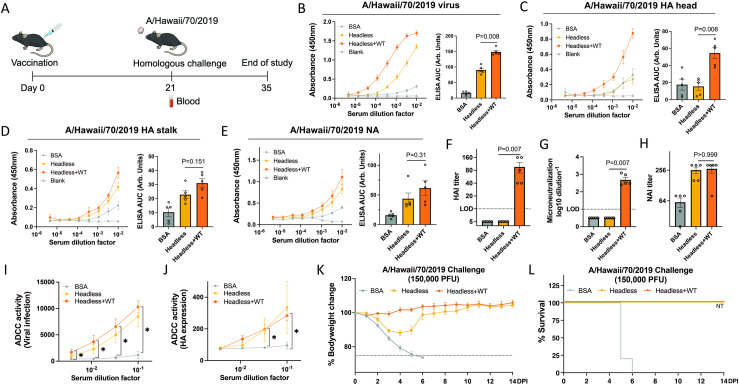
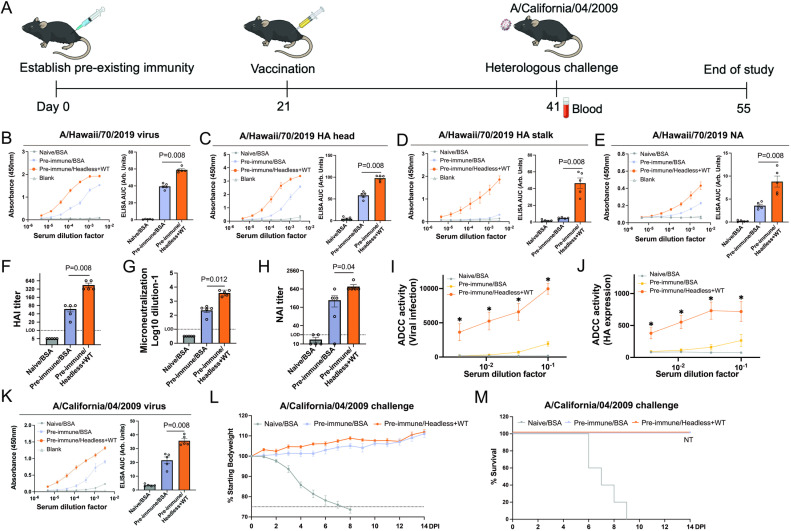
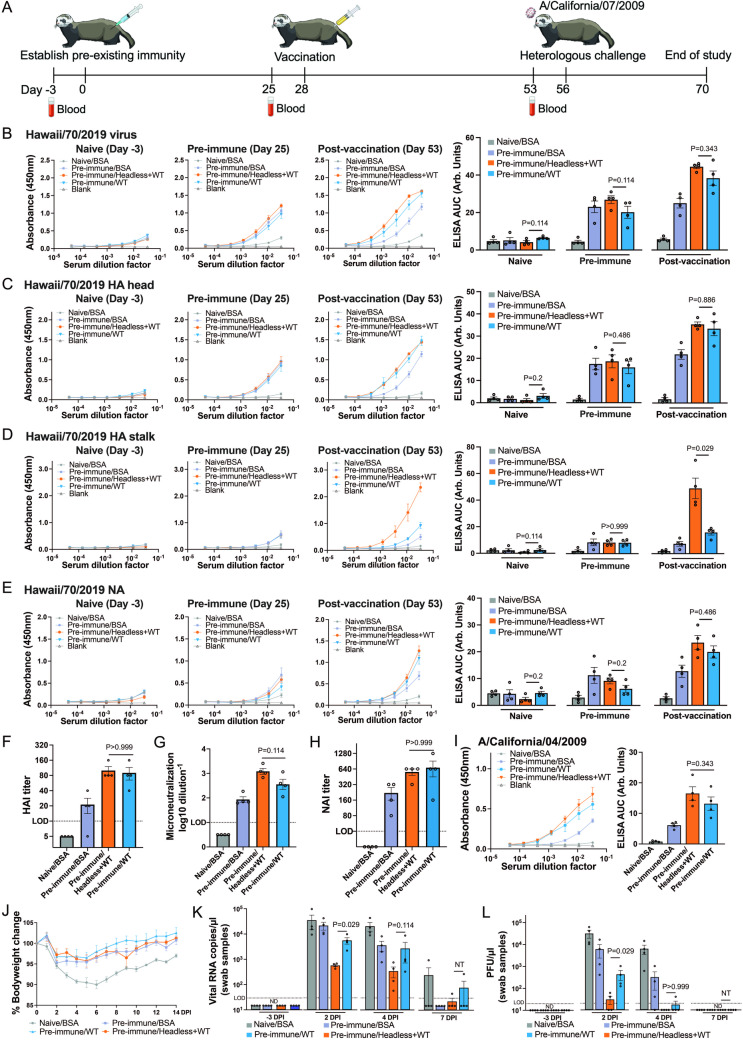
One approach for developing a more universal influenza vaccine is to elicit strong immune responses against canonically immunosubdominant epitopes in the surface exposed viral glycoproteins. While standard vaccines typically induce responses directed primarily against mutable epitopes in the hemagglutinin (HA) head domain, there are generally limited or variable responses directed against epitopes in the relatively more conserved HA stalk domain and neuraminidase (NA) proteins. Here we describe a vaccine approach that utilizes a combination of wildtype (WT) influenza virus particles along with virus particles engineered to display a trimerized HA stalk in place of the full-length HA protein to elicit both responses simultaneously. After initially generating the "headless" HA-containing viral particles in the A/Hawaii/70/2019 (HI/19) genetic background and demonstrating the ability to elicit protective immune responses directed against the HA-stalk and NA, we co-formulated those virions with unmodified WT viral particles. The combination vaccine elicited "hybrid" and protective responses directed against the HA-head, HA-stalk, and NA proteins in both naïve and pre-immune mice and ferrets. Collectively, our results highlight a potentially generalizable method combining viral particles with differential antigenic compositions to elicit broader immune responses that may lead to more durable protection from influenza disease post-vaccination.


Conflict of interest statement

I have read the journal’s policy and the authors of this manuscript have the following competing interests: Duke University has filed for IP protection of the antigen designs and the vaccine platform described in this work.

Figures

Fig 1
Fig 1. Design and generation of a contemporary H1N1 headless HA influenza virus.
(A) The design of the headless HI/19 HA construct. SP, signal peptide. FP, fusion peptide. TM, transmembrane domain. S326T327K328 and N404T405Q406F407T408 were replaced by GSG and GSGGSG linkers, respectively. K395M, Y438D, N439L and E447L mutantions increased internal stabilization. White font on red background represents unchanged residues; dots represent deletions; clear boxes with red font indicates conservative mutantions with amino acids that have similar properties; non-boxed mutations indicate nonconservative mutantions. (B) Recognition of the headless HI/19 HA construct in HEK-293T via flow cytometry. HEK-293T transfected with WT HI/19 HA or the headless HI/19 HA plasmids and after 24 h cells were collected and stained with HA stalk-directed mouse antibody 6F12 (1:50 dilution) and human antibody CR9114 (1:500 dilution). (C) Diagram of the approach to generate the headless HI/19 virus. An image available at https://bioart.niaid.nih.gov/bioart/432 provided by the NIH BioArt source was used in this panel. (D) Flow cytometry of the MDCK cell line stably expressing headless HI/19 HA. (E) Staining of the cell line stably expressing the headless HI/19 HA via immunofluorescence microscopy. Scale bar, 100 μm. Blue, nuclei; Green, HA stalk. (F) HA protein level comparison between WT HI/19 vaccine and normalized headless HI/19 vaccine via ELISA. N = 4 technical replicates. (G) NA protein level comparison between WT HI/19 vaccine and normalized headless HI/19 vaccine via ELISA. N = 4 technical replicates. (H) NP protein level comparison between WT HI/19 vaccine and normalized headless HI/19 vaccine via ELISA. N = 4 technical replicates. All experiments were performed at least two times and similar results were observed. For panels F–H, Mann-Whitney U tests were performed. Data shown as mean ± the standard error of the mean (SEM).
Fig 2
Fig 2. Immunogenicity and protective efficacy of the headless HA HI/19 vaccine in mice.
(A) Schematic of the vaccination regimen and challenge. Images available at https://bioart.niaid.nih.gov/bioart/279, https://bioart.niaid.nih.gov/bioart/505, https://bioart.niaid.nih.gov/bioart/87 and https://bioart.niaid.nih.gov/bioart/187 provided by the NIH BioArt source were used in this panel. (B–E) Sera from the two groups, including headless HI/19 and BSA, collected at 21 days post-vaccination was used to detect antibody responses against whole HI/19 virus (B), HI/19 HA head (C), HA/19 HA stalk (D) and HA/19 NA (E) via ELISA. N = 5 mice. (F) Hemagglutination inhibition assay (HAI) with sera from two groups of mice. HAI titers were calculated as the reciprocal of the last dilution of sera that inhibited hemagglutination. LOD = 10. N = 5 mice. (G) Microneutralization assay with sera from two groups of mice. Limit of detection (LOD) = 1. N = 5 mice. (H) Neuraminidase-inhibition (NAI) assay with sera from two groups of mice. NAI titer is calculated as the reciprocal of the lowest dilution of sera that inhibited at least 50% NA activity. N = 5 mice. (I) Antibody dependent cellular cytotoxicity (ADCC) assay with sera from two groups of mice. N = 5 mice. *, p < 0.05. (J) Body weight of vaccinated mice from two groups was monitored until 14 days post infection. N = 5 mice. (K) Survival of vaccinated mice from two groups was monitored until 14 days post infection. N = 5 mice. Undetectable samples were treated as 50% of LOD for statistical analysis. All experiments were performed at least 2 times and similar results were observed. For panels B-H, Mann-Whitney U tests were performed. For panels I, FDR adjusted p-values from Wilcoxon rank-sum exact tests to control for multiple comparisons were shown. For panel K, log-rank (Mantel-Cox) tests were performed. Data shown as mean ± SEM.
Fig 3
Fig 3. Immunogenicity and protective efficacy of headless HA+WT HI/19 vaccine in mice.
(A) Schematic of the vaccination regimen. Images available at https://bioart.niaid.nih.gov/bioart/279, https://bioart.niaid.nih.gov/bioart/505, https://bioart.niaid.nih.gov/bioart/87 and https://bioart.niaid.nih.gov/bioart/187 provided by the NIH BioArt source were used in this figure panel. (B–E) Sera from the three groups, including headless HA+WT HI/19, headless HI/19 and BSA, collected at 21 days post-vaccination was used to detect antibody responses against whole HI/19 virus (B), HI/19 HA head (C), HI/19 HA stalk (D) and HI/19 NA (E) via ELISA. N = 5 mice. (F) Hemagglutination inhibition assay (HAI) with sera from three groups. HAI titers were calculated as the reciprocal of the last dilution of sera that inhibited hemagglutination. LOD = 10. N = 5 mice. (G) Microneutralization assay with sera from three groups. LOD = 1. N = 5 mice. (H) Neuraminidase-inhibition (NAI) assay with sera from three groups collected at 21 days post-vaccination. NAI titer is calculated as the reciprocal of the lowest dilution of sera that inhibited at least 50% NA activity. N = 5 mice. (I) Antibody dependent cellular cytotoxicity (ADCC) assay on virally infected cells with sera from three groups collected at 21 days post-vaccination. N = 5 mice. *, p < 0.05. (J) ADCC assay as in I, but with target cells only expressing the HA protein. *, p < 0.05. (K) Body weight of vaccinated mice from the three vaccines groups was monitored until 14 days post infection. N = 5 mice. (L) Survival of vaccinated mice from three groups was monitored until 14 days post infection. N = 5 mice. NT, not tested. Undetectable samples were treated as 50% of LOD for statistical analysis. All experiments were performed at least 2 times and similar results were observed. For panels B-H, Mann-Whitney U tests were performed. For panels I and J, FDR adjusted p-values from Wilcoxon rank-sum exact tests to control for multiple comparisons were shown. Data shown as mean ± SEM.
Fig 4
Fig 4. Immunogenicity and protective efficacy of headless HA+WT HI/19 vaccine in mice with pre-existing immunity.
(A) The schematic for establishment of pre-existing immunity followed by vaccination. Images available at https://bioart.niaid.nih.gov/bioart/279, https://bioart.niaid.nih.gov/bioart/505, https://bioart.niaid.nih.gov/bioart/506, https://bioart.niaid.nih.gov/bioart/87, and https://bioart.niaid.nih.gov/bioart/187 provided by the NIH BioArt source were used in this panel. (B–E) Immune sera was used to detect antibody responses against whole HI/19 virus (B), HI/19 HA head (C), HI/19 HA stalk (D) and HI/19 NA (E) via ELISA. N = 5 mice. (F) Hemagglutination inhibition assay (HAI) with immune sera. HAI titers were calculated as the reciprocal of the last dilution of sera that inhibited hemagglutination. LOD = 10. N = 5 mice. (G) Microneutralization assay with immune sera. LOD = 1. N = 5 mice. (H) Neuraminidase-inhibition (NAI) assay with post-boost sera. NAI titer is calculated as the reciprocal of the lowest dilution of sera that inhibited at least 50% NA activity. N = 5 mice. (I) Antibody dependent cellular cytotoxicity (ADCC) assay against infected cells with post-vaccination sera. N = 5 mice. *, p < 0.05. (J) ADCC assay targeting cells only express the viral HA protein. *, p < 0.05. (K) Post-boost sera were used to detect antibody responses against whole A/California/04/2009 virus via ELISA. N = 5 mice. (L) Body weight of vaccinated mice with pre-existing immunity was monitored for 14 days post infection. N ≥ 4 mice. (M) Survival of vaccinated mice with pre-existing immunity was monitored for 14 days post infection. N ≥ 4 mice. NT, not tested. Undetectable samples were treated as 50% of LOD for statistical analysis. All experiments were performed at least 2 times and similar results were observed. For panels B-H and K, Mann-Whitney U tests were performed. For panels I and J, FDR adjusted p-values from Wilcoxon rank-sum exact tests to control for multiple comparisons were shown. Data shown as mean ± SEM.
Fig 5
Fig 5. Immunogenicity and efficacy of the headless HA+WT HI/19 vaccine in ferrets with pre-existing immunity.
(A) Schematic of the vaccine regimen. Ferrets received one dose of WT HI/19 vaccine or BSA to establish pre-existing immunity. After 28 days, ferrets were administered either BSA, WT HI/19 vaccine or the headless HA+WT HI/19 vaccine. After another 28 days, ferrets were challenged with A/California/07/2009 virus. All sera were collected 3 days before vaccination or virus challenge. Images available at https://bioart.niaid.nih.gov/bioart/150, https://bioart.niaid.nih.gov/bioart/505, https://bioart.niaid.nih.gov/bioart/506, https://bioart.niaid.nih.gov/bioart/87 and https://bioart.niaid.nih.gov/bioart/187 provided by the NIH BioArt source were used in this figure panel. (B–E) Naive sera collected before vaccination, sera collected after establishment of pre-existing immunity, and sera collected post-vaccination were used to detect antibody responses against whole HI/19 virus. (B), HI/19 HA head (C), HI/19 HA stalk (D) and HI/19 NA (E) via ELISA. N = 4 ferrets. (F) Hemagglutination inhibition assay (HAI) with post-vaccination sera. HAI titers were calculated as the reciprocal of the last dilution of sera that inhibited hemagglutination. LOD = 10. N = 4 ferrets. (G) Microneutralization assay with post-vaccination sera. LOD = 1. N = 4 ferrets. (H) Neuraminidase-inhibition (NAI) assay with post-vaccination sera. NAI titer is calculated as the reciprocal of the lowest dilution of sera that inhibited at least 50% NA activity. N = 4 ferrets. LOD = 40. (I) Post-vaccination sera was used to detect antibody responses against whole A/California/04/2009 virus via ELISA. N = 4 ferrets. (J) Body weight of vaccinated ferrets with pre-existing immunity was monitored until 14 days post infection. N = 4 ferrets. (K) Viral RNA level in nasal swab samples after infection. Nasal swab samples collected at 3 days before infection, 2 days post-infection (DPI), 4 DPI, 7 DPI were analyzed for RT-qPCR. Viral NP gene was detected. (L) Plaque assay in nasal swab samples after infection. Nasal swab samples were collected at 3 days before infection, 2 DPI , 4 DPI, 7 DPI were analyzed. Undetectable samples were treated as 50% of LOD for statistical analysis. ND, not detected. NT, not tested. Except for panels F-J, all experiments were technically performed at least 2 times and similar results were observed. For panels B-I and K-L, Mann-Whitney U tests were performed. Data shown as mean ± SEM.

Similar articles

References

    1. Taubenberger JK, Morens DM. Influenza: the once and future pandemic. Public Health Rep. 2010;125 (Suppl 3):16–26. ; PMCID: PMC2862331 - PMC - PubMed
    1. Paget J, Spreeuwenberg P, Charu V, Taylor RJ, Iuliano AD, Bresee J, et al.. Global mortality associated with seasonal influenza epidemics: new burden estimates and predictors from the GLaMOR Project. J Glob Health. 2019;9(2):020421. doi: 10.7189/jogh.09.020421 ; PMCID: PMC6815659 - DOI - PMC - PubMed
    1. Palese P, Shaw M. Fields virology. In Orthomyxoviridae: the viruses and their replication. 5th ed, Philadelphia (PA): Lippincott Williams & Wilkins, Wolters Kluwer Business; 2007. p. 1647–89.
    1. Skehel JJ, Wiley DC. Receptor binding and membrane fusion in virus entry: the influenza hemagglutinin. Annu Rev Biochem. 2000;69:531–69. doi: 10.1146/annurev.biochem.69.1.531 - DOI - PubMed
    1. Sanchez-de Prada L, Sanz-Munoz I, de Lejarazu RO, Eiros JM, Garcia-Sastre A, Aydillo T. Immunodominance hierarchy after seasonal influenza vaccination. Emerg Microbes Infect. 2022;11(1):2670–9. doi: 10.1080/22221751.2022.2135460 ; PMCID: PMC9639523 - DOI - PMC - PubMed

MeSH terms