. 2025 Jan 22;20(1):e0317683.
doi: 10.1371/journal.pone.0317683. eCollection 2025.

GsMTx-4 combined with exercise improves skeletal muscle structure and motor function in rats with spinal cord injury

Affiliations

GsMTx-4 combined with exercise improves skeletal muscle structure and motor function in rats with spinal cord injury

Xin Zhang et al. PLoS One. .

Abstract

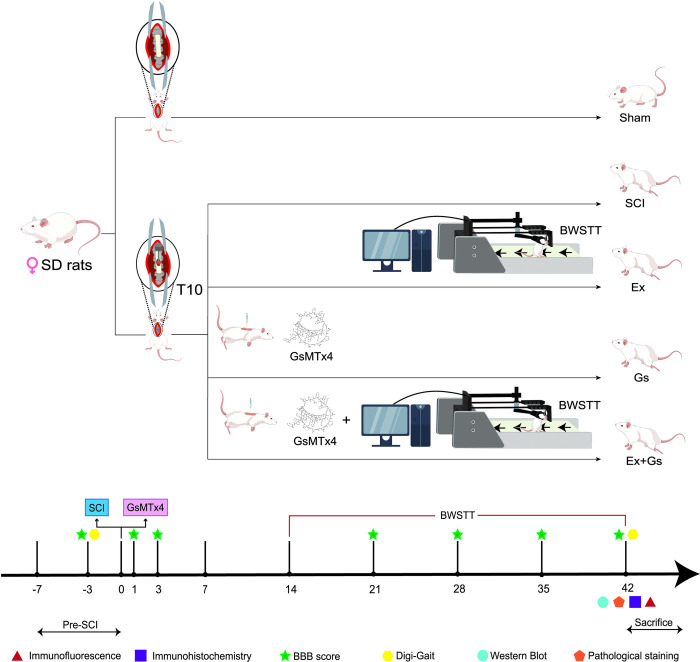
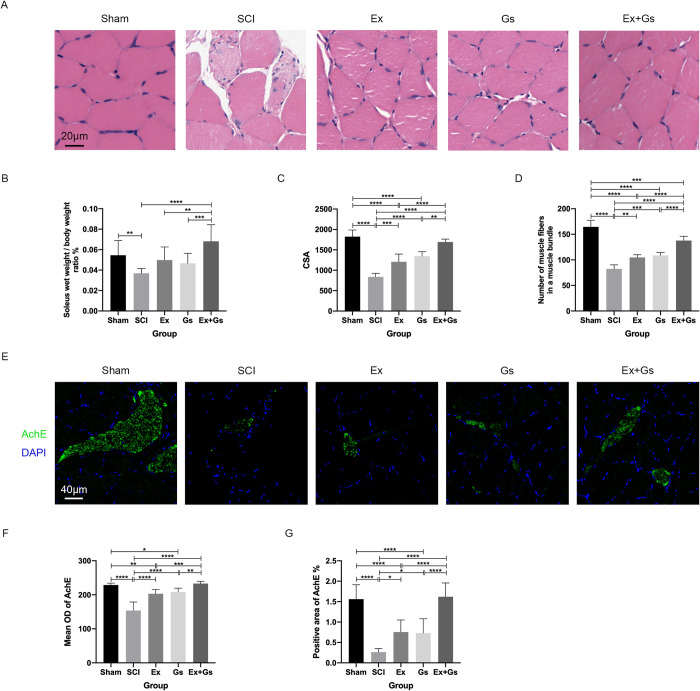
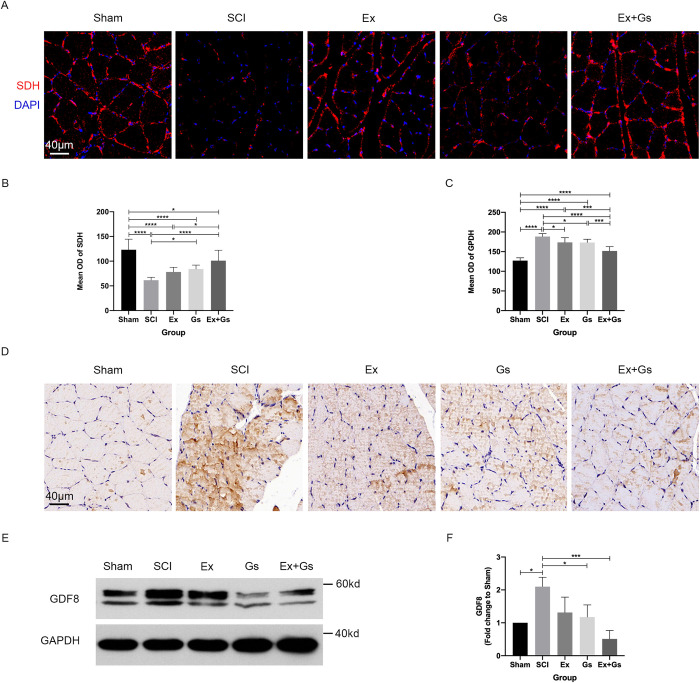
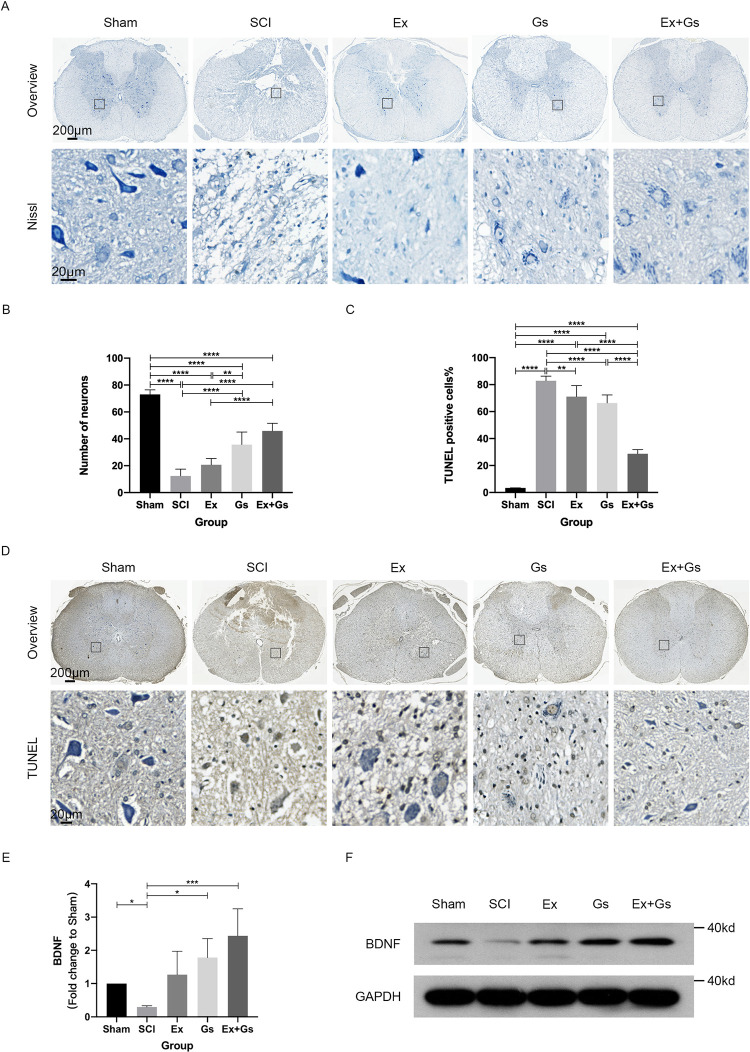
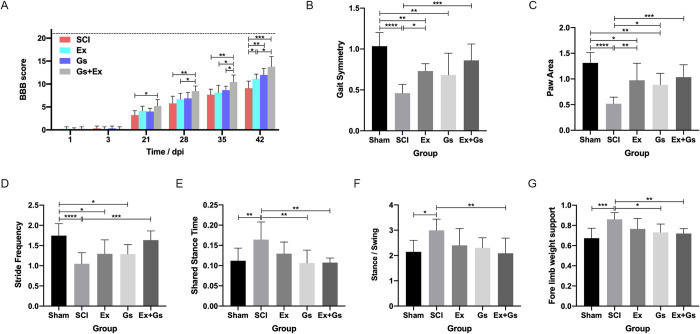
Motor dysfunction and muscle atrophy are typical symptoms of patients with spinal cord injury (SCI). Exercise training is a conventional physical therapy after SCI, but exercise intervention alone may have limited efficacy in reducing secondary injury and promoting nerve regeneration and functional remodeling. Our previous research found that intramedullary pressure after SCI is one of the key factors affecting functional prognosis. It has been reported that GsMTx-4, a specific blocker of the mechanosensitive ion channels Piezo1, can protect the integrity of the neuromuscular junction and promote nerve regeneration, and thus has the potential as a therapeutic agent for SCI. In this study, we observed the combined and separate therapeutic effect of GsMTx-4 and exercise on the structure of the soleus muscle and motor function in rats with SCI. At 42 days post-injury, compared with SCI rats, the Basso-Beattie-Bresnahan score (P = 0.0007) and Gait Symmetry (P = 0.0002) were significantly improved after combination therapy. On histology of rat soleus muscle, compared with SCI rats, the combined treatment significantly increased the wet weight ratio, muscle fiber cross-sectional area and acetylcholinesterase (all P<0.0001). On histology of rat spinal tissue, compared with SCI rats, the combined treatment significantly increased neuron counts and BDNF levels, and significantly reduced the percentage of TUNEL-positive cells (all P<0.0001). On physiology of rat soleus muscle, compared with SCI rats, the combined treatment increased the succinate dehydrogenase expression (P<0.0001), while the expression of α-glycerophosphate dehydrogenase (P<0.0001) and GDF8 protein (P = 0.0008) decreased. Results indicate the combination therapy effectively improves histopathology of spinal cord and soleus muscle in SCI rats, enhancing motor function. This study was conducted on animal models, it offers insights for SCI treatment, advancing understanding of lower limb muscle pathology post-SCI. Further research is needed for clinical validation in the future.


Conflict of interest statement

The authors have declared that no competing interests exist.

Figures

Fig 1
Fig 1. Grouping, experimental procedure, and time points.
The rats were randomly divided into 5 groups, in which the SCI group, Ex group, Gs group, and Ex+Gs group underwent modeling surgery for spinal cord injury at the level of T10. GsMTx-4 was injected by a micro syringe after modeling; BBB score evaluation was performed on day 1 and 3 after modeling to determine whether the modeling was successful. BWSTT (body weight support treadmill training) started on day 14 after modeling in the Ex and Ex+Gs group rats. BBB score evaluation was performed every week for 4 consecutive weeks after training. At the end of the experiment, the digital footprint analysis system (Digital Gait) was used to evaluate the motor function of rats, and pathological staining, IHC, IF, and WB were performed. BBB: Basso–Beattie–Bresnahan; SCI: spinal cord injury; IHC: immunohistochemistry; IF: immunofluorescence; WB: Western Blot.
Fig 2
Fig 2. Combination therapy significantly ameliorated the atrophy of soleus muscles in rats after SCI.
(A) The quantitative analysis of soleus muscle weight in rats. The soleus wet weight/ body weight ratio % was quantified. The data are presented as the means ± SDs, n = 6. One-way ANOVA followed by Tukey’s multiple comparisons test. **P < 0.01, ***P < 0.001, and ****P < 0.0001. (B-D) Representative images and the quantitative analysis of soleus muscle transverse sections stained with HE in rats. Scale bar = 20 μm. The CSA and number of muscle fibers in a muscle bundle were quantified. The data are presented as the means ± SDs, n = 6. One-way ANOVA followed by Tukey’s multiple comparisons test. **P < 0.01, ***P < 0.001, and ****P < 0.0001. (E-G) Representative images and the quantitative analysis of soleus muscle transverse sections stained with anti-AChE in rats. Scale bars = 40 μm. The mean OD of AChE and positive area of AChE% in the soleus muscle sections were quantified. The data are presented as the means ± SDs, n = 9. One-way ANOVA followed by Tukey’s multiple comparisons test. *P < 0.05, **P < 0.01, ***P < 0.001, and ****P < 0.0001. SCI: spinal cord injury.
Fig 3
Fig 3. Combination therapy significantly improved oxidative capacity and myostatin expression in the soleus muscle after SCI.
(A and B) Representative images and the quantitative analysis of soleus muscle transverse sections stained with anti-SDH in rats. Scale bars = 40 μm. The mean OD of SDH in the soleus muscle sections was quantified. The data are presented as the means ± SDs, n = 9. One-way ANOVA followed by Tukey’s multiple comparisons test. *P < .05 and ****P < .0001. (C and D) Representative images and the quantitative analysis of soleus muscle transverse sections stained with anti-GPDH in rats. Scale bars = 40 μm. The mean OD of GPDH in the soleus muscle sections was quantified. The data are presented as the means ± SDs, n = 9. One-way ANOVA followed by Tukey’s multiple comparisons test. *P < 0.05, ***P < 0.001, and ****P < 0.0001. (E and F) Changes in GDF8 expression in rats by WB. The soleus muscle tissue was fractionated to isolate lysosome-enriched fraction and then processed for Western blot. GAPDH was used as the loading control. The fold change relative to Sham was calculated. The data are presented as the means ± SDs, n = 3. One-way ANOVA followed by Tukey’s multiple comparisons test. *P < 0.05 and ***P < 0.001. SCI: spinal cord injury.
Fig 4
Fig 4. Combination therapy significantly alleviated neuronal loss in the spinal cord after SCI.
(A and B) Representative images and the quantitative analysis of spinal cord transverse sections stained with Nissl in rats. Scale bar = 200 μm and 20 μm (overview and magnified image). The numbers of neurons in the ventral horn of the spinal cord were quantified. The data are presented as the means ± SDs, n = 6. One-way ANOVA followed by Tukey’s multiple comparisons test. **P < 0.01 and ****P < 0.0001. (C and D) Representative images of spinal cord transverse sections stained with TUNEL in rats. The red arrows indicate TUNEL-positive cells. Scale bar = 200 μm and 20 μm (overview and magnified image). The TUNEL-positive cells % in the spinal cord sections was quantified. The data are presented as the means ± SDs, n = 6. One-way ANOVA followed by Tukey’s multiple comparisons test. **P < 0.01 and ****P < 0.0001. SCI: spinal cord injury. (E and F) Changes in BDNF expression in rats by WB. The spinal cord tissue was fractionated to isolate lysosome-enriched fraction and then processed for WB. GAPDH was used as the loading control. The fold change relative to Sham was calculated. The data are presented as the means ± SDs, n = 4. One-way ANOVA followed by Tukey’s multiple comparisons test. *P < 0.05 and ***P < 0.001. SCI: spinal cord injury.
Fig 5
Fig 5. BBB scores and gait analysis.
(A) BBB scores on day 1, 3, 21, 28, 35, and 42 after modeling in all groups. (B-G) The results of gait data analysis—gait symmetry, hind paw area, stride frequency, shared stance time, stance/swing, and forelimb weight support—for the Sham, SCI, Ex, Gs, and Ex+Gs groups at day 42 after modeling. The data are presented as the means ± SDs, n = 9. One-way ANOVA followed by Tukey’s multiple comparisons test. *P < 0.05, **P < 0.01, ***P < 0.001, and ****P < 0.0001. BBB: Basso-Beattie-Bresnahan; SCI: spinal cord injury.

Similar articles

References

    1. Martin Ginis KA, van der Scheer JW, Latimer-Cheung AE, Barrow A, Bourne C, Carruthers P, et al.. Evidence-based scientific exercise guidelines for adults with spinal cord injury: an update and a new guideline. Spinal Cord. 2018;56(4):308–21. doi: 10.1038/s41393-017-0017-3 - DOI - PubMed
    1. Giangregorio LM, Hicks AL, Webber CE, Phillips SM, Craven BC, Bugaresti JM, et al.. Body weight supported treadmill training in acute spinal cord injury: impact on muscle and bone. Spinal Cord. 2005;43(11):649–57. doi: 10.1038/sj.sc.3101774 - DOI - PubMed
    1. Zhao BL, Li WT, Zhou XH, Wu SQ, Cao HS, Bao ZR, et al.. Effective robotic assistive pattern of treadmill training for spinal cord injury in a rat model. Exp Ther Med. 2018;15(4):3283–94. doi: 10.3892/etm.2018.5822 - DOI - PMC - PubMed
    1. Sutor TW, Kura J, Mattingly AJ, Otzel DM, Yarrow JF. The Effects of Exercise and Activity-Based Physical Therapy on Bone after Spinal Cord Injury. Int J Mol Sci. 2022;23(2). - PMC - PubMed
    1. Alluin O, Karimi-Abdolrezaee S, Delivet-Mongrain H, Leblond H, Fehlings MG, Rossignol S. Kinematic study of locomotor recovery after spinal cord clip compression injury in rats. J Neurotrauma. 2011;28(9):1963–81. doi: 10.1089/neu.2011.1840 - DOI - PubMed