

Respiratory virus detections in children presenting to an Australian paediatric referral hospital pre-COVID-19 pandemic, January 2014 to December 2019
- PMID: 39841690
- PMCID: PMC12140113
- DOI: 10.1371/journal.pone.0313504
Respiratory virus detections in children presenting to an Australian paediatric referral hospital pre-COVID-19 pandemic, January 2014 to December 2019
Abstract
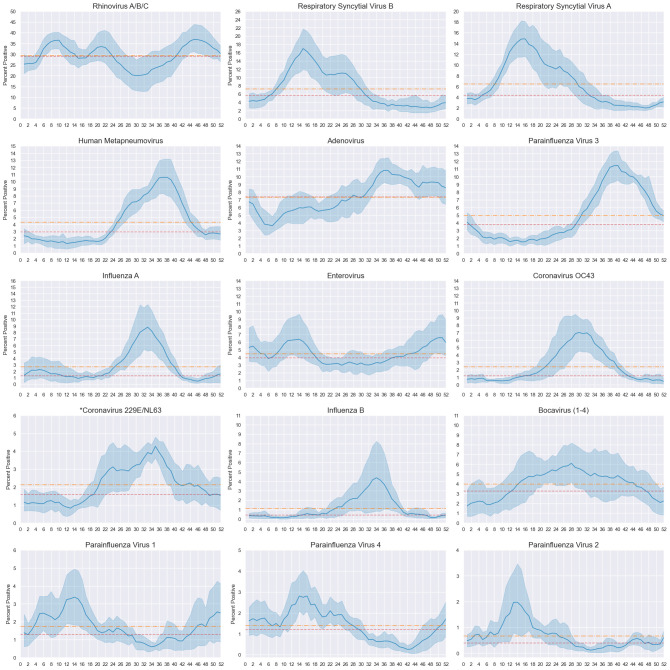
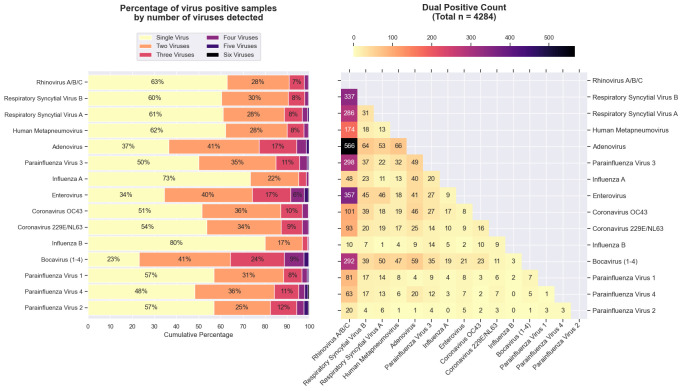
Acute respiratory infections cause significant paediatric morbidity, but for pathogens other than influenza, respiratory syncytial virus (RSV), and SARS-CoV-2, systematic monitoring is not commonly performed. This retrospective analysis of six years of routinely collected respiratory pathogen multiplex PCR testing at a major paediatric hospital in New South Wales Australia, describes the epidemiology, year-round seasonality, and co-detection patterns of 15 viral respiratory pathogens. 32,599 respiratory samples from children aged under 16 years were analysed. Most samples were associated with a hospital admission (24,149, 74.1%) and the median age of sampling was 16 months (IQR 5-53). Viruses were detected in 62.9% (20,510) of samples, with single virus detections occurring in 73.5% (15,082) of positive samples. In instances of single virus detection, rhinovirus was most frequent (5125, 40.6%), followed by RSV-B (1394, 9.2%) and RSV-A (1290, 8.6%). Moderate to strong seasonal strength was observed for most viruses with some notable exceptions. Rhinovirus and enterovirus were detected year-round and low seasonal strength was observed for adenovirus and bocavirus. Biennial seasonal patterns were observed for influenza B and parainfluenza virus 2. Co-detections occurred in 5,428 samples, predominantly with two (4284, 79.0%) or three viruses (904, 16.7%). The most common co-detections were rhinovirus-adenovirus (566, 10.4%), rhinovirus-enterovirus (357, 8.3%), and rhinovirus-RSV-B (337, 7.9%). Ongoing pan-pathogen surveillance, integrating both laboratory and clinical data, is necessary to assist in identification of key pathogens and combination of pathogens to support effective preventative public health strategies and reduce the burden of paediatric respiratory infections.
Copyright: © 2025 Burrell et al. This is an open access article distributed under the terms of the Creative Commons Attribution License, which permits unrestricted use, distribution, and reproduction in any medium, provided the original author and source are credited.
Conflict of interest statement
The authors declare no conflict of interest for this study publication.
Figures
References
-
- Vos T, Lim SS, Abbafati C, Abbas KM, Abbasi M, Abbasifard M, et al. Global burden of 369 diseases and injuries in 204 countries and territories, 1990–2019: a systematic analysis for the Global Burden of Disease Study 2019. The Lancet 2020;396:1204–22. doi: 10.1016/S0140-6736(20)30925-9 - DOI - PMC - PubMed
-
- Australian Institute of Health and Welfare. Infectious and communicable diseases. Canberra: 2022.
-
- ANZICS Centre for Outcome and Resource Evaluation. Australia and New Zealand Paediatric Intensive Care Registry Activity Report 2018. Melbourne: 2019.
-
- Centre for Epidemiology and Evidence, NSW Ministry of Health. HealthStats NSW Acute respiratory infection hospitalisations. NSW Combined Admitted Patient Epidemiology Data and ABS Population Estimates (SAPHaRI) 2020. http://www.healthstats.nsw.gov.au/Indicator/res_acreshos/res_acreshos?&t... (accessed November 23, 2021).
MeSH terms
LinkOut - more resources
Full Text Sources
Medical
Miscellaneous
