. 2025 Jan 22;20(1):e0308195.
doi: 10.1371/journal.pone.0308195. eCollection 2025.

Proper 5'-3' cotranslational mRNA decay in yeast requires import of Xrn1 to the nucleus

Affiliations

Proper 5'-3' cotranslational mRNA decay in yeast requires import of Xrn1 to the nucleus

Antonio Jordán-Pla et al. PLoS One. .

Abstract

The budding yeast Xrn1 protein shuttles between the nucleus, where it stimulates transcription, and the cytoplasm, where it executes the major cytoplasmic mRNA decay. In the cytoplasm, apart from catalyzing 5'→3' decay onto non translated mRNAs, Xrn1 can follow the last translating ribosome to degrade the decapped mRNA template, a process known as "cotranslational mRNA decay". We have previously observed that the import of Xrn1 to the nucleus is required for efficient cytoplasmic mRNA decay. Here by using an Xrn1 mutant that cannot enter the nucleus, but is otherwise functional in ribonuclease activity, we show that nuclear import is necessary for proper global cotranslational decay of mRNAs along coding regions and also affects degradation in the of 5' region of a large group of mRNAs, which comprise about 20% of the transcriptome. Furthermore, a principal component analysis of the genomic datasets of this mutant and other Xrn1 mutants also shows that lack of a cytoplasmic 5'→3' exoribonuclease is the primary cause of the physiological defects seen in a xrn1Δ mutant, but also suggests that Xrn1 import into the nucleus is necessary for its full in vivo functions.


Conflict of interest statement

VP is a co-founder and shareholder of 3N Bio AB. All the other authors declare no conflict of interest. VP does not receive any salary from 3N Bio and the company did not play any role in this study. VP role in 3N Bio AB does not alter our adherence to PLOS ONE policies on sharing data and material.

Figures

Fig 1
Fig 1. The only-cytoplasmic version of the Xrn1 protein (Xrn1ΔNLS1/2) partially restores the wild-type HT-5Pseq profile.
A-C) The high-resolution metagene analysis for the HT-5Pseq read coverage in relation to the ORF start and stop codon for the wild-type (XRN1) with a version lacking NLS1 (xrn1ΔNLS1) or NLS2 (xrn1ΔNLS2), or both NLSs (xrn1ΔNLS1/2). In A and B the region around the start codon is shown at two Y scales. In A it can be seen the differences between the samples analyzed in this study. In B and C an xrn1Δ sample from another study [21] normalized for the total reads is added as a reference of a strain with no cytoplasmic 5’→3’ exoribonuclease activity. Note that the scales in both panels, B (around START codon) and C (around STOP codon), differ. Please note that the 3 bp periodicity seen in xrn1Δ is different (displaced -1nt) from the one observed in the wild-type cells. In xrn1Δ, the periodicity is likely caused by the activity of endonucleases in absence of cytoplasmic 5’-3’activity combined with the uneven distribution of nucleotides along the coding region. Thus, it does not inform regarding single-nucleotide ribosome positions as explained in reference [10]. In C the profile around the stop codon is shown. -17 marks the strong peak caused by the ribosome paused at the stop codon. D) The average metagene plot of the HT-5Pseq normalized counts over the coding sequence and the flanking regions of all the protein-coding genes for the HT-5Pseq samples. Note that the X scale in the coding region is given in relative distance units, whereas the upstream START and downstream STOP regions come in natural units. The genebody-spanning metagene plots were generated using the default curve smoothing implemented in ngs.plot with the whole sequencing read. This contrasts to the plots from panel A, generated using the Fivepseq package, where only the most 5’ nucleotide was employed. This explains the apparent different position of the 5’ peak in both panels. A version of this plot including the xrn1Δ sample from another study [21] is shown in S3 Fig. E) A comparative boxplot of the relative frame protection index (FPI) values between the WT and xrn1ΔNLS1/2. The xrn1Δ sample from another study [21] is used as a reference. **** = p < 0.0001 using a Wilcoxon test. F) The average metagene plots showing the HT-5Pseq coverage around the entire coding sequence (left) or only around the START codon for each 10 k-means cluster from the WT dataset (top) and for xrn1ΔNLS1/2 (bottom). Note that the X scale in the coding region is given in relative distance units, whereas the upstream START and downstream STOP regions come in natural units in the left panels, and the expanded scale in the right panels is expressed in only natural units. Also note that the Y scale in D & F panels are different from A-C panels as explained in M&M. Three biological replicates of the HT-5Pseq were done and averaged. In S4 Fig the individual tracks for wild-type and xrn1ΔNLS1/2 are shown.
Fig 2
Fig 2. Characterization of the Kem1 5’-Decay Import-Sensitive (KDIS) genes.
A) Mapping of the GO terms to KDIS and Cluster #10 genes. Only the top 10 enriched GO terms are shown, according to the adjusted p-value using a Benjamini-Hochberg (BH) test. Note the enrichment in GO terms related to cytoplasmic translation in both groups. B) The average metagene plots of KDIS and non KDIS after normalizing by their mRNA level values [20]. C) Comparison of the transcription levels of KDIS (n = 1020), cluster #10 (n = 510) and the other (non KDIS, n = 5134) genes. We used the BioGRO values from a wild-type (WT) strain [31] as a measure of the nascent transcription rates. D) The average metagene profiles of all the protein-coding genes (n = 6664), KDIS (n = 1020) and non KDIS (including cluster #10, n = 5644) for the cRat1 strain described in [21] compared to the WT and xrn1Δ. E) Boxplots showing the length of 5’UTR, CDS and 3’UTR and the 5’TUR and 3’TUR (from ref. [32]) of KDIS and cluster #10 genes. F) Comparison of the FPI values of the different groups of genes in xrn1ΔNLS1/2 vs. the WT. G) Comparison of the fold change of the FPI values in the xrn1ΔNLS1/2/WT for different groups of genes. All the compared groups display a similar drop in the FPI in xrn1ΔNLS1/2. H) Boxplots showing mRNA abundance (RA), abundance in the soluble fraction and relative 5’-degradation (from ref. [33]) of KDIS and cluster #10 genes. The significance of the median comparisons in panels C, E-H, was estimated using a Wilcoxon test: ns = p>0.05; * = p< 0.05; ** = p< 0.01; *** = p< 0.001; **** = p< 0.0001.
Fig 3
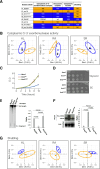
Fig 3. Principal component analysis (PCA) of the transcriptional genomic data of several yeast strains with different 5→3’exonuclease activity.
We used the genome-wide GRO data described in the main text from previously published three experiments: (ref. [15]: Dataset #1, ref. [20]: Dataset #2 and ref. [21] (dataset #3). A) The table shows the known features (from refs. [15,20,21]) that characterize the studied strains marked by different colors (YES in blue, NO in orange) corresponding to the dot colors in parts B and E. Note that xrn1ΔNLS1 is classified as deficient in shuttling because it has only a very minor capacity of nuclear Xrn1 import (see [20]). B) How Dimensions 1 and 2 in the PCA analysis separate the individuals with YES and NO in the “5’→3’decay” feature for the mRNA half-life (HL), the mRNA concentration (RA) and the mRNA synthesis rate (SR) is depicted. Blue triangles correspond to the strain samples which have the 5’→3’decay capacity (YES in panel A); orange dots depict the samples without it (NO in part A). The black square corresponds to the undetermined S454P sample. Big triangles and dots represent the centroid (mean) of the group highlighted by an oval. C) Growth rate shown as O.D. vs time of culture for the wild-type (WT), xrn1Δ and xrn1S454P strains used for the S454P mutation test. D) Growth of same strains in media with glycerol (as the sole carbon source) and in synthetic complete (SC) medium. E) Effect of S454P mutation on degradation, measured by Northern blotting. Degradation of RPL30pG [33] in the WT, the xrn1S454P mutant and xrn1Δ; degradation of RPL30pG leaves a Poly-G tract as a degradation fragment. The ratio of the fragment to the full-length RPL30pG is presented here. The results represent the averages of two replicates (±SD). F) Effect of the S454P mutation on NMD, measured by Northern blotting. A representative example is shown. In this image a few irrelevant lanes were removed, but otherwise the contrast and intensity were not changed. The ratio of mRNA to the pre-mRNA of RPL28 is presented in the right graph. The results represent the averages of two replicates (±SD). G) Dimensions 1 and 4 separate the groups for the “shuttling” feature. Symbols as in part B). nd, not determined. All the other binary combinations for dimensions 1 to 4 showed no significant clustering for the analyzed features (not shown).

References

    1. Heyer WD, Johnson AW, Reinhart U, et al.. Regulation and intracellular localization of Saccharomyces cerevisiae strand exchange protein 1 (Sep1/Xrn1/Kem1), a multifunctional exonuclease. Mol Cell Biol. 1995; 15: 728–2736. doi: 10.1128/MCB.15.5.2728 - DOI - PMC - PubMed
    1. Parker R, Song H. The enzymes and control of eukaryotic mRNA turnover. Nat Struct Mol Biol. 2004; 11(2):121–127. doi: 10.1038/nsmb724 . - DOI - PubMed
    1. Nagarajan VK, Jones I, Newbury SF, et al.. XRN 5’→3’ exoribonucleases: structure, mechanisms and functions. Biochim Biophys Acta. 2013; 1829:590–603. doi: 10.1016/j.bbagrm.2013.03.005 - DOI - PMC - PubMed
    1. Chang JH, Xiang S, Tong L. 50–30 Exoribonucleases. In: Nicholson A. W. (Eds.) Ribonucleases. 2011. Vol. 7. Heidelberg: Springer, pp. 167–192.
    1. Langeberg CJ, Welch WRW, McGuire JV, et al.. Biochemical characterization of yeast Xrn1. Biochemistry. 2020; 59:1493–1507. doi: 10.1021/acs.biochem.9b01035 - DOI - PMC - PubMed

MeSH terms