. 2025 Jan 22;21(1):e1012530.
doi: 10.1371/journal.ppat.1012530. eCollection 2025 Jan.

Spatiotemporal profile of an optimal host response to virus infection in the primate central nervous system

Affiliations

Spatiotemporal profile of an optimal host response to virus infection in the primate central nervous system

Olga A Maximova et al. PLoS Pathog. .

Abstract

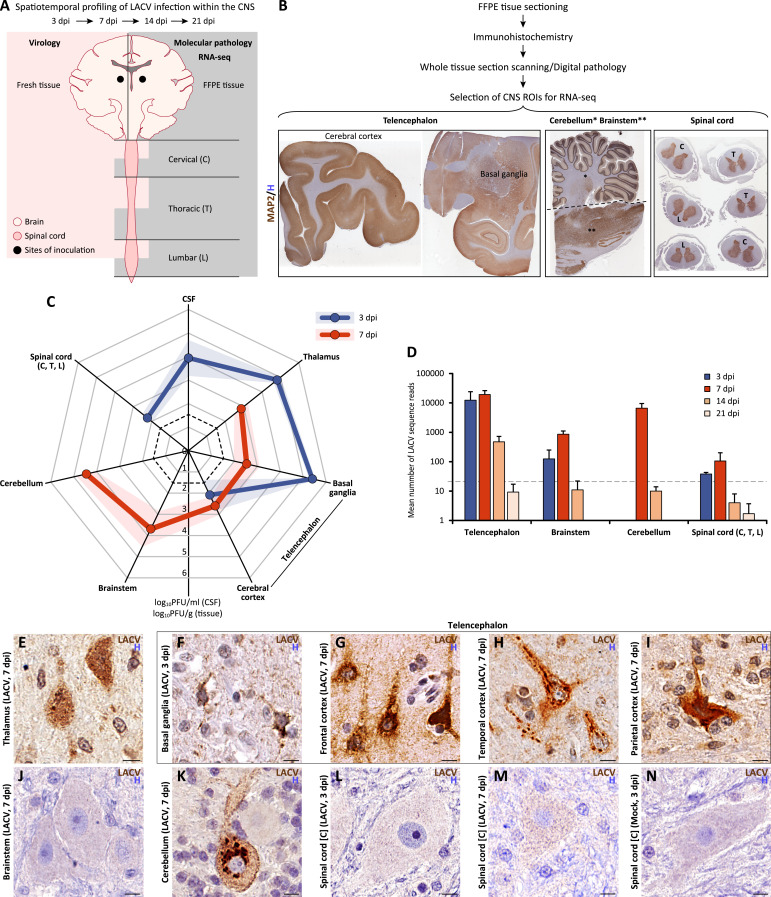
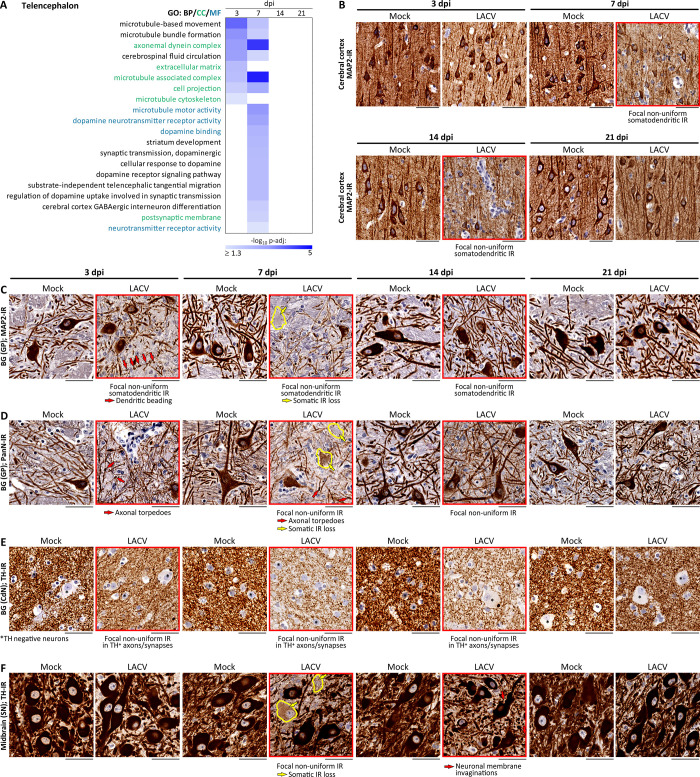
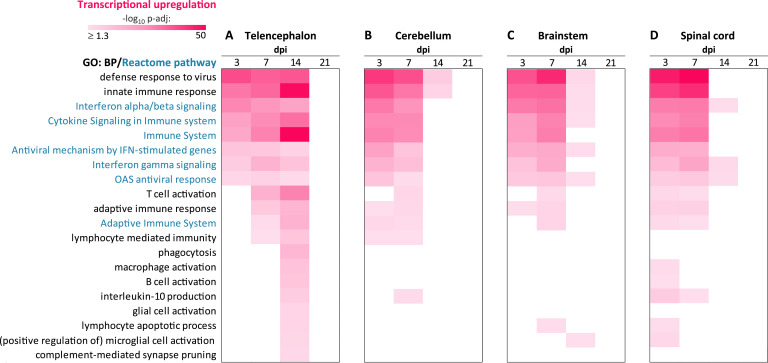
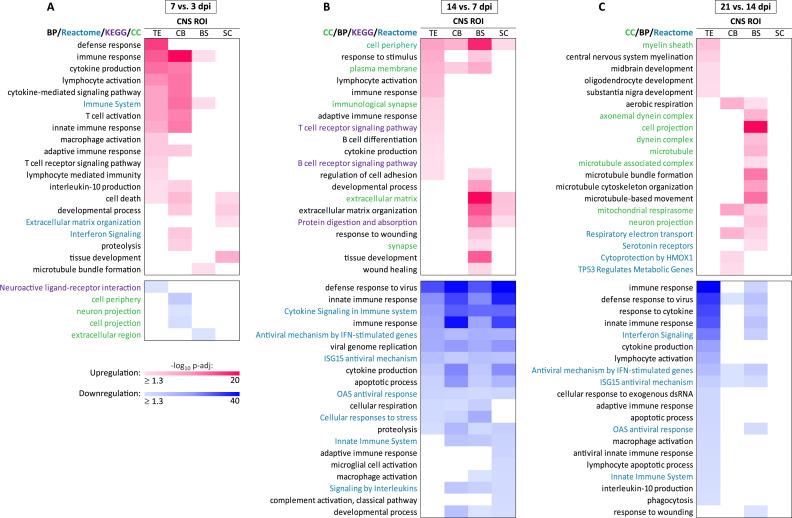
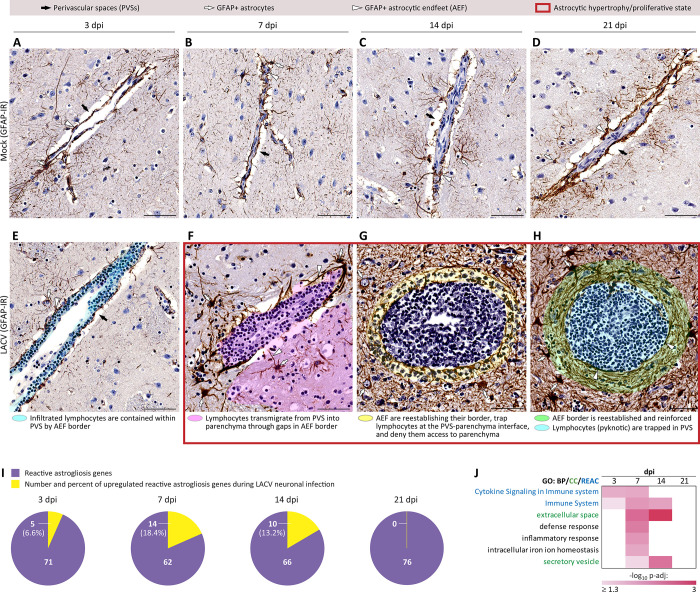
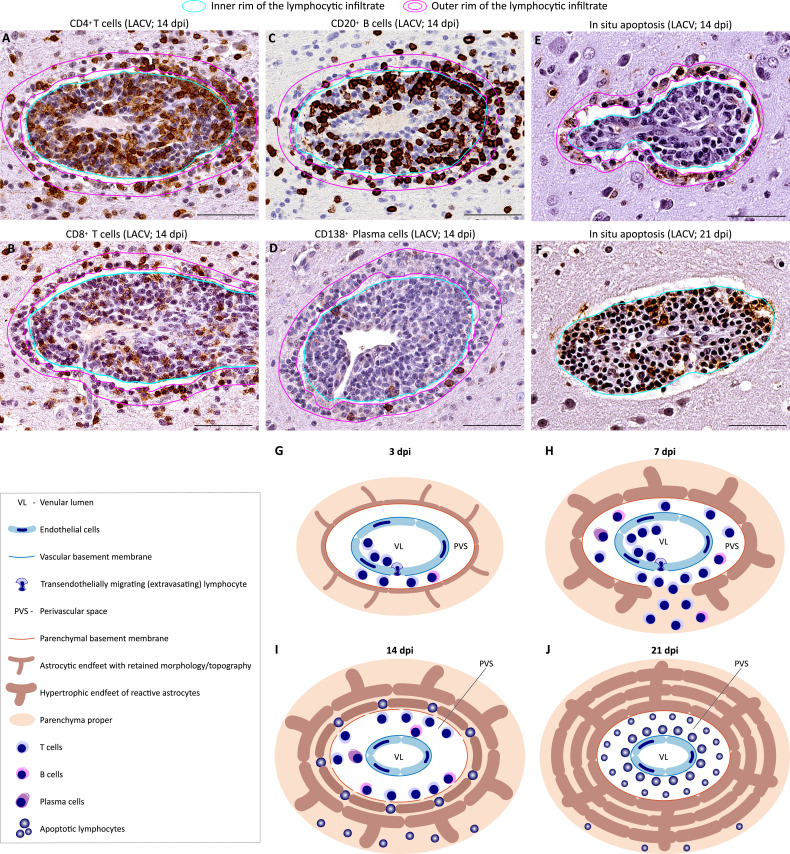
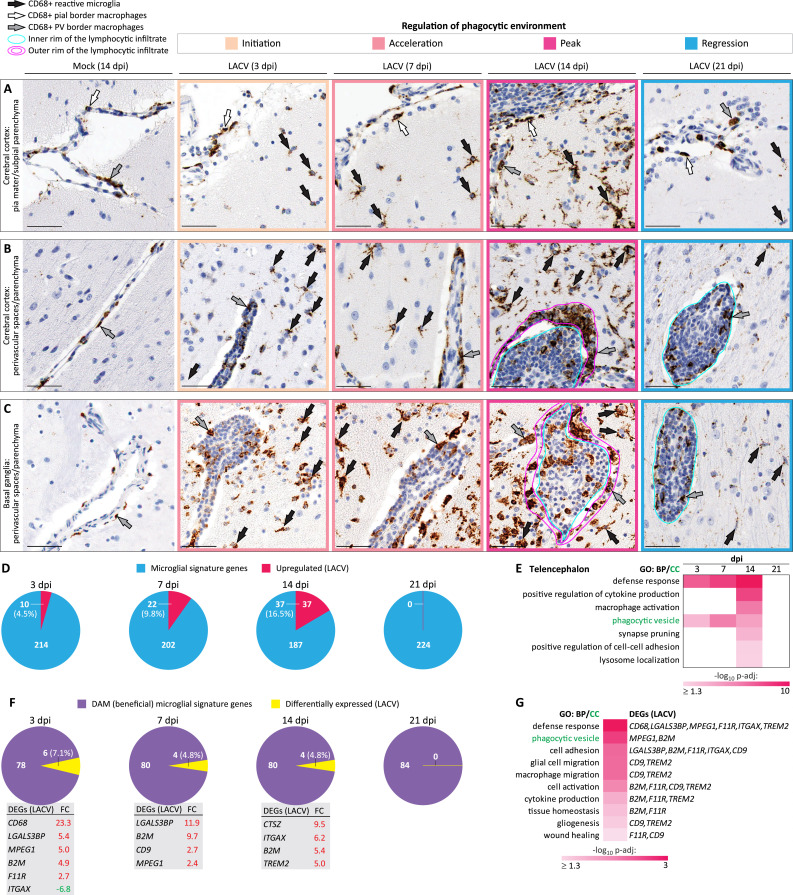
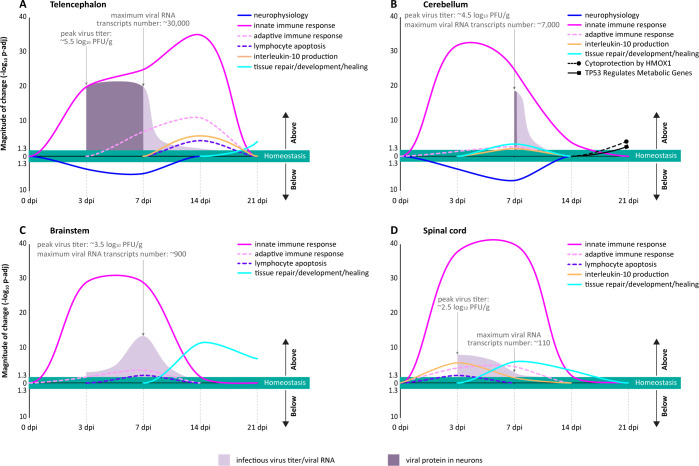
Viral infections of the central nervous system (CNS) are a major cause of morbidity largely due to lack of prevention and inadequate treatments. While mortality from viral CNS infections is significant, nearly two thirds of the patients survive. Thus, it is important to understand how the human CNS can successfully control virus infection and recover. Since it is not possible to study the human CNS throughout the course of viral infection at the cellular level, here we analyzed a non-lethal viral infection in the CNS of nonhuman primates (NHPs). We inoculated NHPs intracerebrally with a high dose of La Crosse virus (LACV), a bunyavirus that can infect neurons and cause encephalitis primarily in children, but with a very low (≤ 1%) mortality rate. To profile the CNS response to LACV infection, we used an integrative approach that was based on comprehensive analyses of (i) spatiotemporal dynamics of virus replication, (ii) identification of types of infected neurons, (iii) spatiotemporal transcriptomics, and (iv) morphological and functional changes in CNS intrinsic and extrinsic cells. We identified the location, timing, and functional repertoire of optimal transcriptional and translational regulation of the primate CNS in response to virus infection of neurons. These CNS responses involved a well-coordinated spatiotemporal interplay between astrocytes, lymphocytes, microglia, and CNS-border macrophages. Our findings suggest a multifaceted program governing an optimal CNS response to virus infection with specific events coordinated in space and time. This allowed the CNS to successfully control the infection by rapidly clearing the virus from infected neurons, mitigate damage to neurophysiology, activate and terminate immune responses in a timely manner, resolve inflammation, restore homeostasis, and initiate tissue repair. An increased understanding of these processes may provide new therapeutic opportunities to improve outcomes of viral CNS diseases in humans.


Conflict of interest statement

The authors have declared that no competing interests exist.

Figures

Fig 1
Fig 1. Spatiotemporal profile of virus infection in the CNS of NHPs intrathalamically inoculated with LACV.
(A and B) Integrative design shows the timing, tissue samples, and downstream analyses used in this study. Abbreviations for the spinal cord regions in B are indicated in A. (C) Radar graph shows mean LACV titers (± standard errors; shaded areas) in the CNS regions of interest (ROIs) at indicated dpi. Dashed line indicates the limit of detection (1.7 log10 PFU). Data on LACV titers in the CNS of each individual NHP (from two NHPs per time point) are provided in S2 Fig. (D) Mean number of LACV sequence reads (± SE) per 100 ng of RNA detected by RNA-seq in the FFPE tissue in indicated CNS ROIs of LACV-infected NHPs at indicated dpi. Dashed line shows the background threshold based on the three times the number of reads in mock at 3 dpi (n = 21). (E—N) Representative cellular immunoreactivity for LACV Gc glycoprotein (LACV, brown) with hematoxylin counterstaining (H, blue) in indicated CNS ROIs of LACV-infected NHPs (E—M) and one representative mock (N) at indicated dpi. Scale bars (E—N): 10 μm.
Fig 2
Fig 2. Time-limited downregulation of neurophysiological processes in the CNS of NHPs during LACV infection.
(A) Temporal heatmap shows functional enrichment for transcriptional downregulation of the neurophysiological processes during 3 weeks after LACV inoculation. The color scale is based on the significance (negative log10 of the adjusted p-values [-log10 p-adj]). The gene ontology (GO) sources: BP, Biological Process; CC, Cellular Component; and MF, Molecular Function (terms are highlighted by respective colors). Lists of genes downregulated in the telencephalon at each dpi and data associated with (A) are provided in S1 File. (B—F) Transient focal changes in the cellular compartments of neurons in the telencephalon: (B) cerebral cortex; (CE) basal ganglia (BG) (C and D, globus pallidus [GP]; E, caudate nucleus [CdN]); and (F) midbrain (substantia nigra [SN]) during LACV infection are revealed by the morphological changes in immunoreactivity (IR; brown with blue counterstaining) for indicated proteins. LACV panels show representative areas from two NHPs at indicated dpi side-by-side with the dpi-matched mock for comparisons. Supporting information that includes digital pathology analysis at increasing magnifications for both LACV-infected NHPs at each dpi is provided in S3 Fig. Indicated IRs reveal the following cellular compartments of neurons: MAP2-IR—somatodendritic compartments (B and C); PanN-IR—neuronal somata, dendrites, and axons (D); TH- (tyrosine hydroxylase)-IR—(i) excitatory projections (axons) and terminals (synapses) of nigral neurons (F) that innervate the TH negative BG neurons (E) and (ii) excitatory dopaminergic nigral neurons and their processes. Panels with indicated pathological changes in the neuronal cellular compartments are framed in red. Neurons with the somatic loss of indicated IR at 7 dpi are outlined in yellow in C, D, and F (tissue fields were chosen to include neighboring neurons with higher levels of respective IR to serve as internal control). Supporting information for corresponding changes in the protein IRs in dpi matched LACV-infected NHPs other than shown in D—F is provided in S4 Fig. Scale bars: 50 μm (B—F).
Fig 3
Fig 3. Transcriptional activation of host defense responses in the CNS of NHPs during LACV infection.
(A—D) Temporal heatmaps show significant functional annotations based on genes that were upregulated (compared to the dpi-matched mock) in indicated CNS ROIs during LACV infection. The color scale is based on the level of significance and expressed as the negative log10 of the adjusted p-values (-log10 p-adj). The gene ontology sources GO: BP (Biological Process) and Reactome pathways were used and indicated by corresponding text colors. Top 20 manually collapsed significant genomic terms of interest are plotted for all comparisons. Lists of genes upregulated in the telencephalon, cerebellum, brainstem, and spinal cord at each dpi and data associated with (A—D) are provided in S2 File.
Fig 4
Fig 4. Time-differential transcriptional regulation of the CNS of NHPs during LACV infection.
(A—C) Heatmaps show the time-differential (a time point of interest versus a preceding probed time point) functional changes in the transcriptional upregulation (red gradient) and downregulation (blue gradient) in four CNS ROIs (TE, telencephalon; CB, cerebellum; BS, brainstem; and SC, spinal cord). Differentially expressed genes were identified by comparing expression between the time points indicated above each heatmap. The color scales (-log10 p-adj) in (A) also apply to (B) and (C). Gene ontology sources are indicated in each heatmap by corresponding text colors. Top 20 manually collapsed significant genomic terms of interest are plotted for all comparisons, except for downregulation in (A), which was relatively limited. Lists of upregulated and downregulated genes analyzed in the telencephalon, cerebellum, brainstem, and spinal cord and data associated with (A—C) are provided in S3 File.
Fig 5
Fig 5. Time-limited bi-directional control of lymphocytic fate by reactive astrocytes at the perivascular-parenchymal interface during LACV infection of the CNS in NHPs.
(A—H) Representative sections of the glial fibrillary acidic protein immunoreactivity (GFAP-IR; brown with blue counterstaining) show astrocytic behavior in the telencephalon at indicated dpi in mock (A—D) and LACV-infected NHPs (EH). Labeling keys at the top apply to all panels in A—H. Labeling used to highlight the spatiotemporal changes in behavior of astrocytes and lymphocytes is provided below each corresponding panel in E—H. Note a reduced size and pyknotic appearance of lymphocytes within the territory overlayed in yellow at 14 dpi (G) and within the territory overlayed in cyan at 21 dpi (H). Supporting information for corresponding GFAP-IR in dpi matched LACV-infected NHPs other than shown in E—H is provided in S4I–S4L Fig. Scale bars (A—H): 50 μm. (I) Pie charts showing the overlaps (numbers and percentages) in genes that were upregulated during LACV infection and genes involved in reactive astrogliosis [34]. (J) Temporal heatmap (labeling as described in Fig 3) showing significant functional annotations based on all upregulated reactive astrogliosis genes identified in the overlaps (yellow in panel I).
Fig 6
Fig 6. Phenotypic composition and fate of infiltrating lymphocytes during LACV infection of the CNS in NHPs.
(A—F) Adjacent sections of the same venule in the telencephalon show the phenotype of lymphocytes at the peak of their infiltration (14 dpi) based on the immunoreactivity (brown with blue counterstaining) for indicated lymphocytic markers (AD) and in situ apoptosis detection with ApopTag staining (brown) at 14 dpi (E) and 21 dpi (F). Labeling keys used in A—D are at the top of the figure. Scale bars (A—F): 50 μm. (GJ) Schematic summary of the fate of the infiltrating lymphocytes during neuronal virus infection that is spatiotemporally controlled by astrocytes (based on the findings shown in E, and F, and Fig 5E–5H. Anatomical landmarks and cell types are indicated in the box on the left. See text for a detailed description of the processes illustrated in G—J.
Fig 7
Fig 7. Regulation of phagocytic environment in the CNS of NHPs during LACV infection.
(A—C) CD68-IR visualizes reactive microglia and CNS-border macrophages in the telencephalon. The cell labeling keys are referenced in the top left, followed by the color keys used to highlight the specific panels representing stages in regulation of the phagocytic environment. Each row compares representative morphological changes associated with CD68+ phagocytic cells indicated in the top left corner (brown with blue counterstaining) during LACV infection at indicated dpi (see S4M–S4P Fig for corresponding CD68-IR in dpi matched LACV-infected NHPs other than shown) and mock (14 dpi shown here as a reference for the peak changes in LACV; see S7 Fig for CD68-IR in the mock telencephalon at all time points). Scale bars (A—C): 50 μm. (D—E) Temporal dissection of functional microglial changes in the telencephalon based on the overlaps of genes differentially expressed during LACV infection and known sets of (i) microglial signature genes [35] (D and E) and (ii) disease-associated microglia (DAM) genes [36] (F and G). Overlapping differentially expressed genes (DEGs) with corresponding significant (p-adj < 0.05) log2 fold changes (FCs) are listed below the pie charts. (E) Temporal heatmap (labeling as described in Fig 3) shows significant functional annotations based on the upregulated microglial genes identified in the overlaps in panel D. (G) Significant functional genomic terms for all DEGs identified in the overlaps in panel F.
Fig 8
Fig 8. Spatiotemporal reconstruction of an optimal transcriptional regulation of host responses to virus infection of neurons in the CNS of NHPs.
(A—D) Summary of major region-specific functional changes in the CNS transcriptome during 3 weeks after intrathalamic LACV inoculation. The plotted magnitude of change (y axes) for the selected biological processes and pathways in indicted CNS ROIs is based on the significance values (-log10 p-adj). The territory of the homeostasis (green area in each plot) is statistically defined as being not significantly different from the normal physiological conditions (i.e., dpi-matched mock) at a cut-off of 1.3 -log10 p-adj (FDR-adjusted p < 0.05). The indicated functional terms were manually collapsed based on the enrichment data presented in Figs 2A, S5A, S6A, 3, and 4. For the areas above the homeostasis territory (upward arrows in each graph), the upward direction in the plotted curves represents active transcriptional upregulation, whereas the downward direction implies cessation of transcriptional upregulation, active transcriptional downregulation, or both. For the areas below the homeostasis territory (downward arrows in each graph), the downward direction in the plotted curves (present only in A and B) represents active transcriptional downregulation, whereas the upward direction implies cessation of transcriptional downregulation, active transcriptional upregulation, or both. The shaded areas (keys are at the bottom of the figure) are derived from Fig 1 and superimposed to show the kinetics of virus replication (peak titers of infectious virus and maximal numbers of viral RNA transcripts) and production of viral protein in neurons.

Similar articles

Cited by

References

    1. Griffin DE. Immune responses to RNA-virus infections of the CNS. Nature reviews Immunology. 2003;3(6):493–502. doi: 10.1038/nri1105 - DOI - PMC - PubMed
    1. Koyuncu OO, Hogue IB, Enquist LW. Virus infections in the nervous system. Cell host & microbe. 2013;13(4):379–93. doi: 10.1016/j.chom.2013.03.010 - DOI - PMC - PubMed
    1. Klein RS, Hunter CA. Protective and Pathological Immunity during Central Nervous System Infections. Immunity. 2017;46(6):891–909. doi: 10.1016/j.immuni.2017.06.012 - DOI - PMC - PubMed
    1. Maximova OA, Pletnev AG. Flaviviruses and the Central Nervous System: Revisiting Neuropathological Concepts. Annual review of virology. 2018;5(1):255–72. doi: 10.1146/annurev-virology-092917-043439 - DOI - PubMed
    1. Klein RS, Garber C, Funk KE, Salimi H, Soung A, Kanmogne M, et al.. Neuroinflammation During RNA Viral Infections. Annual review of immunology. 2019;37:73–95. doi: 10.1146/annurev-immunol-042718-041417 - DOI - PMC - PubMed

MeSH terms

LinkOut - more resources