. 2025 Jan 22;21(1):e1012875.
doi: 10.1371/journal.ppat.1012875. eCollection 2025 Jan.

A pan-orthohantavirus human lung xenograft mouse model and its utility for preclinical studies

Affiliations

A pan-orthohantavirus human lung xenograft mouse model and its utility for preclinical studies

Melanie Rissmann et al. PLoS Pathog. .

Abstract

Orthohantaviruses are emerging zoonotic viruses that can infect humans via the respiratory tract. There is an unmet need for an in vivo model to study infection of different orthohantaviruses in physiologically relevant tissue and to assess the efficacy of novel pan-orthohantavirus countermeasures. Here, we describe the use of a human lung xenograft mouse model to study the permissiveness for different orthohantavirus species and to assess its utility for preclinical testing of therapeutics. Following infection of xenografted human lung tissues, distinct orthohantavirus species differentially replicated in the human lung and subsequently spread systemically. The different orthohantaviruses primarily targeted the endothelium, respiratory epithelium and macrophages in the human lung. A proof-of-concept preclinical study showed treatment of these mice with a virus neutralizing antibody could block Andes orthohantavirus infection and dissemination. This pan-orthohantavirus model will facilitate progress in the fundamental understanding of pathogenesis and virus-host interactions for orthohantaviruses. Furthermore, it is an invaluable tool for preclinical evaluation of novel candidate pan-orthohantavirus intervention strategies.


Conflict of interest statement

I have read the journal's policy and the authors of this manuscript have the following competing interests: The Icahn School of Medicine at Mount Sinai has filed patent applications relating to SARS-CoV-2 serological assays, NDV-based SARS-CoV-2 vaccines, influenza virus vaccines and influenza virus therapeutics which list FK as co-inventor and of which several have been licensed. Mount Sinai has spun out a company, Kantaro, to market serological tests for SARS-CoV-2 and another company, Castlevax, to develop SARS-CoV-2 vaccines. FK is co-founder and scientific advisory board member of Castlevax. FK has consulted for Merck, Curevac, Seqirus and Pfizer and is currently consulting for 3rd Rock Ventures, GSK, Gritstone and Avimex. The Krammer laboratory is also collaborating with Dynavax on influenza vaccine development. All other authors have no conflicts of interest to report.

Figures
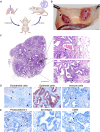
Fig 1
Fig 1. Human lung xenograft development and characterization.
a) Human fetal lung tissues were implanted into four separate subcutaneous pockets on the back of at least 8 weeks old NOD.Cg-PrkdcscidIl2rgtm1Wjl/SzJ (NSG) mice. These xenografts were left for a maturation period of at least 12 weeks. Created in BioRender. 1, V. (2025) https://BioRender.com/r28y992. b) Macroscopic appearance of human lung xenografts, after longitudinal dissection and lifting of the murine skin. The human lung tissues developed into encapsulated and highly vascularized (arrow) human lung xenografts (*) that are connected to the blood circulation of the mouse (arrow head). Scale bar represents 1 cm. c) Histological appearance of human lung xenografts. The xenograft is composed of blood vessels (a), cartilaginous airways (b), cartilage (c) and non-cartilaginous airways (d). Scale bar represents 800 µm. Top zoom-in shows endothelial cells (indicated by arrow head) lining a blood vessel. Scale bar represents 20 µm. Bottom zoom-in shows respiratory, partially ciliated (indicated by arrow head), epithelium lining a non-cartilaginous airway. Scale bar represents 50 µm. d) Immunohistochemistry staining for endothelial cells (Von Willebrand factor+, indicated by arrow heads), respiratory epithelial cells (cytokeratin 19+) and immune cells (CD45+, indicated by arrow heads). Scale bars represent 20 μm. e) Immunohistochemistry staining for orthohantavirus entry (co-)receptors protocadherin-1, β3 integrin and CD55 as indicated by arrow heads in each image. Scale bar represents 20 μm.
Fig 2
Fig 2. Experimental set-up of the human lung xenograft mouse model.
The replicative potentials of Andes orthohantavirus (ANDV), Sin Nombre orthohantavirus (SNV), causative agents of hantavirus cardiopulmonary syndrome (HCPS), and Hantaan orthohantavirus (HTNV) and Seoul orthohantavirus (SEOV), causative agents of hemorrhagic fever with renal syndrome (HFRS), were evaluated in the human lung xenograft mouse model. In each of the 24 animals per virus, a maximum of two human lung xenografts were directly inoculated (intragraft inoculation) with 30 µl of 1.0 x 10⁶ TCID50 of ANDV, SNV, HTNV or SEOV. To examine if systemic viral dissemination could serve as an alternative infection route of orthohantaviruses, all remaining (maximum of two) xenografts were left non-inoculated. Following inoculation, the body weight of all animals was monitored regularly. On 1, 3, 10 and 21 days post inoculation (dpi), animals (N = 6) from each experimental group were euthanized. During all necropsies, the xenografts, murine lungs, liver, kidney, spleen and serum were collected for quantification of viral RNA load as well as histopathological examination. Additionally, directly inoculated xenografts of 10 and 21 dpi were analyzed by multiplex bead-assay. Two additional control groups were included in which animals were sacrificed at 21 dpi. Grafted, but non-inoculated animals served as control for human lung tissue composition. Non-grafted animals were subcutaneously inoculated with 30 µl of 1.0 x 10⁶ TCID50 as controls for susceptibility of the NSG mice to orthohantavirus infection. Created in BioRender. 1, V. (2025) https://BioRender.com/i75m985.
Fig 3
Fig 3. Replication kinetics of distinct orthohantaviruses.
a) Infectious viral titers were quantified in human lung xenografts that were directly inoculated with ANDV, SNV, HTNV and SEOV. b) Infectious viral titers were determined in non-inoculated xenografts. Squares indicate the mean TCID50 per gram tissue and error bars represent the standard error of the mean. c) Viral RNA was detected in serum via RT-qPCR. Squares indicate the mean TCID50 equivalents per ml and error bars represent the standard error of the mean. Infectious titers in directly inoculated xenografts (a), non-inoculated xenografts (b) and viral RNA in serum (c) were compared to the lowest infectious titer (a, b) or viral RNA load (c) during the course of infection, i.e., 1 or 3 days post inoculation (dpi) by Kruskall-Wallis test with Dunn’s multiple comparisons test. *p < 0.05, **p < 0.005, ***p < 0.001, ****p < 0.0001. Six animals were included per virus per time point.
Fig 4
Fig 4. Quantification of orthohantavirus antigen in human lung xenografts.
a) Orthohantavirus nucleoprotein (N) was detected via immunohistochemistry. Representative images are shown for ANDV-, SNV-, HTNV- and SEOV-inoculated human lung xenografts at 21 days post inoculation (dpi), together with a representative image of human lung xenografts from mice that were left uninfected. Scale bars represent 10 µm. Top right inset images offer a zoom-in of individually infected cells as indicated by arrow heads. b) Quantification of virus antigen-positive cells was performed by counting the number of positive cells for antigen staining per ten high power fields (HPFs). Each circle represents one directly inoculated xenograft. c) Each light colored triangle represents one non-inoculated xenograft. Bars represent the mean and error bars represent the standard error of the mean. The dashed line indicates upper limit of detection (ULoD). Number of virus antigen-positive cells in directly inoculated (b) and non-inoculated (c) xenografts were compared on 3, 10 and 21 dpi to the number of virus antigen-positive cells on 1 dpi by Kruskall-Wallis test with Dunn’s multiple comparisons test. *p < 0.05, **p < 0.005, ***p < 0.001, ****p < 0.0001. Six animals were included per virus per time point.
Fig 5
Fig 5. Orthohantavirus tropism in human lung xenografts.
Representative images for immunofluorescence staining of orthohantavirus antigen in different cell types at 21 days post inoculation. As representative example, ANDV-inoculated human lung xenografts and xenografts from mice that were left uninfected are displayed. Viral tropism for endothelial cells was determined by co-localization of Von Willebrand factor (magenta) and orthohantavirus N (yellow); tropism for respiratory epithelial cells by cytokeratin (magenta) and orthohantavirus N (yellow); tropism for macrophages by co-localization of CD68 (magenta) and orthohantavirus N (yellow). Nuclei are displayed in cyan. Top right inset images offer a zoom-in of individually infected cells as indicated by white arrow heads. Scale bars represent 20 µm.
Fig 6
Fig 6. IP-10 levels in orthohantavirus-infected human lung xenografts.
Human IP-10 levels were measured in tissue homogenates of directly inoculated human lung xenografts. Circles represent individual xenografts, bars represent the mean and error bars represent the standard error of the mean. IP-10 levels were expressed as picogram cytokine per gram tissue. IP-10 levels of orthohantavirus-infected xenografts on 10 and 21 days post inoculation (dpi) were compared to samples from mice that were left uninfected by Kruskall-Wallis test with Dunn’s multiple comparisons test. *p < 0.05, **p < 0.005, ***p < 0.001. For each virus group, one xenograft was included per animal per time point (N = 6), with N = 5 for HTNV at 21 dpi. For the uninfected control group, all xenografts from uninfected animals (N = 4) were included.
Fig 7
Fig 7. Preclinical application of the human lung xenograft mouse model.
a) Overview of the timeline and experimental set-up of the preclinical antibody prophylactic protection study. Mice were either treated with 25 mg/kg monoclonal antibody KL-AN-5E8 or CR9114 (sham) intraperitoneally one day prior to infection. Subsequently, mice were infected via intragraft inoculation of 30 μl of 106 TCID50/ml ANDV in maximum two human lung xenografts. Remaining xenografts were left non-inoculated. Mice treated with KL-AN-5E8 (N = 5) or sham antibody (N = 5) were necropsied at 3 days post inoculation (dpi). The remaining mice received an additional dose of 25 mg/kg monoclonal antibody. At 10 dpi, the remaining mice (N = 4 for KL-AN-5E8; N = 5 for sham) were necropsied and evaluated for protection against viral replication. Created in BioRender. 1, V. (2025) https://BioRender.com/m32p764. b) ANDV RNA loads were quantified by RT-qPCR in homogenates of non-inoculated human lung xenografts and in murine serum. Each circle indicates one evaluated xenograft, each unfilled diamond represents viremia of one single animal. c) ANDV RNA loads were quantified in homogenates of directly inoculated human lung xenografts. Viral RNA loads were expressed as TCID50 equivalents per gram tissue on the left Y-axis, or TCID50 equivalents per ml serum on the right Y-axis. Error bars represent the standard error of the mean. d) ANDV N was detected via immunohistochemistry. Representative images of human lung xenografts are shown for KL-AN-5E8- and sham-treated mice at 10 dpi. Presence of virus antigen is indicated by arrow heads. Scale bars represent 10 µm. Top right inset image offers a zoom-in of individually infected cells. e) Quantification of virus antigen-positive cells was performed by counting the number of positive cells for antigen staining per ten high power fields (HPFs). Each symbol indicates one evaluated xenograft. Circles represent directly inoculated xenografts and light colored triangles represent non-inoculated xenografts. Bars represent the mean and error bars represent the standard error of the mean. Results of each treatment group for viral RNA loads in non-inoculated (b), directly inoculated (c) xenografts, and number of viral antigen-positive cells in all analyzed xenografts (e) were compared with a two-tailed Mann Whitney U test on 3 and 10 dpi. **p < 0.005, ***p < 0.001, ****p < 0.0001.

Similar articles

Cited by

References

    1. Martínez VP, Di Paola N, Alonso DO, Pérez-Sautu U, Bellomo CM, Iglesias AA, et al.. “Super-spreaders” and person-to-person transmission of Andes virus in Argentina. N Engl J Med. 2020;383(23):2230–41. doi: 10.1056/NEJMoa2009040 - DOI - PubMed
    1. Pizarro E, Navarrete M, Mendez C, Zaror L, Mansilla C, Tapia M, et al.. Immunocytochemical and ultrastructural evidence supporting that Andes hantavirus (ANDV) is transmitted person-to-person through the respiratory and/or salivary pathways. Front Microbiol. 2020;102992. doi: 10.3389/fmicb.2019.02992 - DOI - PMC - PubMed
    1. Zaki SR, Greer PW, Coffield LM, Goldsmith CS, Nolte KB, Foucar K, et al.. Hantavirus pulmonary syndrome. Pathogenesis of an emerging infectious disease. Am J Pathol. 1995;146(3):552–79. - PMC - PubMed
    1. Noack D, Goeijenbier M, Reusken CBEM, Koopmans MPG, Rockx BHG. Orthohantavirus pathogenesis and cell tropism. Front Cell Infect Microbiol. 2020;10:399. doi: 10.3389/fcimb.2020.00399 - DOI - PMC - PubMed
    1. Franks TJ, Colby TV, Travis WD, Tuder RM, Reynolds HY, Brody AR. Resident cellular components of the human lung: current knowledge and goals for research on cell phenotyping and function.. ProcAm Thorac Soc. 2008;5(7):763–6. doi: 10.1513/pats.200803-025HR - DOI - PubMed

Substances