. 2025 Jan 24;11(4):eadq2395.
doi: 10.1126/sciadv.adq2395. Epub 2025 Jan 22.

Noncanonical role of Golgi-associated macrophage TAZ in chronic inflammation and tumorigenesis

Affiliations

Noncanonical role of Golgi-associated macrophage TAZ in chronic inflammation and tumorigenesis

So Yeon Park et al. Sci Adv. .

Abstract

Until now, Hippo pathway-mediated nucleocytoplasmic translocation has been considered the primary mechanism by which yes-associated protein (YAP) and transcriptional co-activator with PDZ-binding motif (TAZ) transcriptional coactivators regulate cell proliferation and differentiation via transcriptional enhanced associate domain (TEAD)-mediated target gene expression. In this study, however, we found that TAZ, but not YAP, is associated with the Golgi apparatus in macrophages activated via Toll-like receptor ligands during the resolution phase of inflammation. Golgi-associated TAZ enhanced vesicle trafficking and secretion of proinflammatory cytokines in M1 macrophage independent of the Hippo pathway. Depletion of TAZ in tumor-associated macrophages promoted tumor growth by suppressing the recruitment of tumor-infiltrating lymphocytes. Moreover, in a diet-induced metabolic dysfunction-associated steatohepatitis model, macrophage-specific deletion of TAZ ameliorated liver inflammation and hepatic fibrosis. Thus, targeted therapies being developed against YAP/TAZ-TEAD are ineffective in macrophages. Together, our results introduce Golgi-associated TAZ as a potential molecular target for therapeutic intervention to treat tumor progression and chronic inflammatory diseases.


Figures

Fig. 1.
Fig. 1.. TLR-mediated TAZ induction in macrophages during the resolution of inflammation.
(A) WWTR1 (TAZ) and YAP mRNA levels in adherent (n = 47) and hematopoietic (n = 17) cell lines were analyzed using Human Protein Atlas data and processed using Student’s t tests. ****P < 0.0001. GAPDH, glyceraldehyde-3-phosphate dehydrogenase. (B) Immunoblotting compared protein expression between nonmacrophage [human embryonic kidney (HEK) 293, HaCaT, mouse embryonic fibroblast (MEF), and SVEC] and macrophage (peritoneal macrophages, Raw264.7, iBMDM, and BV2) cell lines. (C) Immunoblotting analyzed TAZ expression in Raw264.7 cells with LPS (100 ng/ml), Pam3CSK4 (100 ng/ml), Poly(I:C) (50 ng/ml), or TPA (100 nM) for 16 hours, with MEF as a control. (D) qPCR analysis of TAZ mRNA in Raw264.7 cells treated with LPS (100 ng/ml), Pam3CSK4 (100 ng/ml), Poly(I:C) (50 ng/ml), or TPA (100 nM) for 16 hours. One-way analysis of variance (ANOVA) with Bonferroni tests. *P < 0.05, ***P < 0.001. (E) Immunoblotting analysis of TAZ expression in Raw264.7 cells treated with E. coli (2 × 10⁶ CFU/ml and 6 × 10⁶ CFU/ml) or LPS (100 or 300 ng/ml) for 16 hours. (F) Immunofluorescence images of TAZ (green) and YAP (red) in Raw264.7 cells treated with LPS (100 ng/ml) or TPA (100 nM) for 16 hours. Three dimensional confocal reconstructions included. Scale bar, 3 μm. (G) Immunoblotting analysis of TAZ expression in BMDMs treated with LPS (100 ng/ml), Pam3CSK4 (100 ng/ml), or Poly(I:C) (50 ng/ml) with or without serum for 24 hours. (H) Immunoblotting analysis of TAZ expression in Raw264.7 cells treated with Poly(I:C) or the RIG-I agonists poly(dA:dT), 5p-dsRNA, or 3p-hpRNA with or without transfection reagent for 24 hours. (I to L) TAZ mRNA and protein levels were measured in Raw264.7 cells treated with LPS (100 ng/ml), Poly(I:C) (50 ng/ml), Pam3CSK4 (100 ng/ml), TPA(100 nM) or TPA + ionomycin (1 μg/ml) for 2, 10, or 21 hours. The data were analyzed by one-way ANOVA with Bonferroni tests for multiple comparisons. ****P < 0.0001.
Fig. 2.
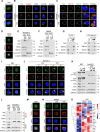
Fig. 2.. Golgi localization and Hippo-independent regulation of TAZ in activated macrophages.
(A to D) Immunofluorescence images show TAZ localization: (A) TAZ (green) in the nucleus of MEF cells; (B) TAZ (green) and RCAS1 (red) in Raw264.7 cells treated with LPS or TPA for 16 hours; (C) TAZ (magenta), GM130 (red), and TGN38 (green) in Raw264.7 cells treated with LPS for 16 hours; (D) TAZ (green) and GM130 (red) in hMDMs treated with LPS for 24 hours. Scale bars, 3 μm (A to C) and 10 μm (D). (E and F) Immunoblotting analysis of cytoplasmic and nuclear fractions in Raw264.7 (E) and BMDM (F) cells treated with LPS or TPA for 16 hours. β-Actin/Lamin A/C: cytosolic/nuclear markers. (G and H) Immunoblotting of Golgi fractions in Raw264.7 cells treated with or without LPS for 16 hours. (I) Immunofluorescence images showing TAZ (green) and GM130 (red) in MEF cells with or without serum. Scale bar, 3 μm. (J) TAZ (green) and GM130 (red) localization in Raw264.7 cells treated with LPS or TPA with or without serum. Scale bar, 15 μm. (K) Immunoblotting of TAZ phosphorylation status in MEF or Raw264.7 cells pretreated with TAZ inhibitors, statin (0.5 and 1 μM), or Lat B (0.1 and 0.2 μg/ml). Upper and lower arrowheads show phosphorylated and dephosphorylated TAZ and YAP. (L) Immunoblotting and Co-IP analysis of TAZ in MEF and Raw264.7 cells treated with LPS or TPA. (M and N) Immunofluorescence of pan-TEAD (green) and TEAD4 (red) in MEF cells (M) and BMDMs treated with LPS or TPA (N). Scale bar, 3 μm. (O) Heatmap from RNA sequencing (RNA-seq) data shows canonical TAZ/YAP-TEAD target gene expression in Raw264.7 cells treated with or without LPS in siControl- or siTaz-transfected cells. [(A) to (O)] All experiments used LPS (100 ng/ml) and TPA (100 nM).
Fig. 3.
Fig. 3.. TEAD inhibitors fail to affect YAP/TAZ-TEAD target genes in macrophages.
(A and B) qPCR analysis of CTGF and CYR61 mRNA expression levels in Y-meso-26B (A) and 92.1 (B) cells treated for 24 hours with the TEAD inhibitors VT-104 or IK-930 (1 or 3 μM). The data were analyzed by one-way ANOVA with Bonferroni tests for multiple comparisons. **P < 0.01, ***P < 0.001, ****P < 0.0001. (C) qPCR analysis of TAZ mRNA expression levels in Raw264.7 cells treated with TEAD inhibitors VT-104 or IK-930 (1 or 3 μM) together with LPS (100 ng/ml) for 24 hours. The data were analyzed by one-way ANOVA with Bonferroni tests for multiple comparisons. *P < 0.05; ns, not significant (P > 0.05). (D) qPCR analysis of Ctgf and Cyr61 mRNA expression levels in Raw264.7 cells treated with TEAD inhibitors VT-104 or IK-930 (1 or 3 μM) with LPS (100 ng/ml) for 24 hours. The data were analyzed by one-way ANOVA with Bonferroni tests for multiple comparisons. ns, not significant (P > 0.05). (E) qPCR analysis of Il-6, Mcp-1, Il-27, and Il-1α mRNA expression levels in Raw264.7 cells treated with TEAD inhibitors VT-104 or IK-930 (1 or 3 μM) together with LPS (100 ng/ml) for 24 hours. The data were analyzed by one-way ANOVA with Bonferroni test for multiple comparisons. *P < 0.05, **P < 0.01, ***P < 0.001, ****P < 0.0001; ns, not significant (P > 0.05).
Fig. 4.
Fig. 4.. Golgi-associated TAZ promotes cytokine secretion in M1 macrophages.
(A and B) Immunoblotting of TAZ expression in Raw264.7 cells (A) and BMDMs (B) treated with LPS/LPS + IFN-γ or IL4/IL4 + IL13 for 24 hours. (C and D) Immunoblotting of TAZ expression in Raw264.7 cells (C) and BMDMs (D) treated with LPS/LPS + IFN-γ or IL4/IL4 + IL13 for 8 hours, followed by transfection with control or Taz siRNAs for 24 hours. (E) Heatmap from RNA-seq data showing gene expression changes in Raw264.7 cells stimulated with LPS and transfected with control or Taz siRNAs. (F and G) Gene ontology analysis of differentially expressed genes from (E). Database for Annotation, Visualization, and Integrated Discovery (DAVID) functional annotation revealed enrichment in biological processes (F) and cellular components (G). (H) Cytokine levels in Raw264.7 cells stimulated with LPS for 8 hours and then transfected with control or Taz siRNAs for 24 hours. Data were analyzed using Student’s t tests. *P < 0.05, **P < 0.01. (I) Immunofluorescence images showing IL-6 (green) and GM130 (red) in Raw264.7 cells treated with LPS and control or Taz siRNAs for 18 hours. Scale bar, 3 μm. (J) Quantification of IL-6 localization in the Golgi in LPS-stimulated Raw264.7 cells. Data analyzed with Student’s t tests, presented as means ± SEM. **P < 0.01. (n): control (6), LPS + siCon (6), LPS + siTaz (7). (K) Schematic of the VSVG-RUSH secretion assay. (L) Immunofluorescence images of VSVG-SBP-EGFP in Raw264.7 cells stimulated with LPS for 20 hours and transfected with control or Taz siRNAs; visualized after biotin addition for 90 mins. Scale bar, 3 μm. (M) Quantification of VSVG colocalization with GM130 at different time points. Data analyzed by Student’s t tests, presented as means ± SEM. ***P < 0.001. siCon (n): 0 min (20), 90 min (23); siTaz (n): 0 min (21), 90 min (20).
Fig. 5.
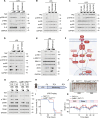
Fig. 5.. The role of the TLR-TAZ signaling in acute inflammatory responses.
(A) Immunoblotting analysis of MAPK-TAZ signaling component expression in LPS (100 ng/ml)–stimulated Raw264.7 cells after treatment with SB203580, U0126, or SP600125 (0.3, 1, or 3 μM) for 16 hours. (B) Immunoblotting analysis of MAPK-TAZ signaling component expression in LPS (100 ng/ml)–stimulated Raw264.7 cells after treatment with U0126 (1 or 3 μM), PD0325901 (1 or 3 μM), or trametinib (30 or 100 nM) for 16 hours. (C) Immunoblotting analysis of MAPK-TAZ signaling component expression in LPS (100 ng/ml)–stimulated Raw264.7 cells after treatment with U0126, L779450, sorafenib, PLX4032, or PLX4720 (1 or 3 μM) for 16 hours. (D) Immunoblotting analysis of NF-κB–TAZ signaling component expression in LPS (100 ng/ml)–stimulated Raw264.7 cells after treatment with TPCA-1 (0.1, 0.3, or 1 μM), IKK-16 (0.1, 0.3, or 1 μM) or SP100030 (0.1 or 0.3 μM) for 16 hours. (E) Immunoblotting analysis of TBK1-TAZ signaling component expression in LPS (100 ng/ml)–stimulated Raw264.7 cells after treatment with Amlexanox or MRT67307 (1, 3, or 10 μM) for 16 hours. (F) Schematic illustrating the signaling pathway that regulates TAZ expression in macrophages. (G) Immunoblotting analysis of TAZ expression in BMDMs isolated from TAZflox/flox and LysMcre; TAZflox/flox mice treated with TPA (100 nM) and ionomycin (1 ug/ml) for 24 hours. (H) Experimental scheme illustrating the LPS septic shock model. Mice were intraperitoneally injected with LPS (27 mg/kg body weight) and monitored for 60 hours. (I) The survival rates of TAZflox/flox and LysMcre; TAZflox/flox mice were measured for 60 hours (n = 12 per group). Statistics were analyzed by log-rank Mantel-Cox test. ns, not significant (P > 0.05). (J) Representative photographs of colon tissues subjected to DSS-induced colitis (n = 6 per group). (K) Experimental scheme illustrating the DSS and water treatment cycle applied to TAZflox/flox and LysMcre.
Fig. 6.
Fig. 6.. The role of TAZ in tumor-associated macrophages during immune cell infiltration.
(A) Immunoblotting analysis of TAZ expression in Raw264.7 cells treated with various cytokines, including IL-6, IL-1β, IL-12, IFN-γ, IL-4, IL-10, or IL-13 [IL-6, IL-1β, and IL-12 (100 ng/ml); IFN-γ, IL-4, IL-10, and IL-13 (20 ng/ml)] for 24 hours. (B) Immunoblotting of TAZ signaling components and IL-6 downstream pathway components in Raw264.7 cells treated with various doses of AZD-1486, ruxolitinib (1, 3, or 10 μM), or C188-9 (10, 20, or 30 μM) for 16 hours. (C) Schematic illustrating the phase 1 and 2 signaling pathways that mediate TAZ induction in macrophages. (D) Immunoblotting analysis of TAZ expression in Raw264.7 cells cocultured with noncancer cell lines (MEF, 3T3L1, SVEC, HEK293A, or HK2) for 24 hours. (E) Immunoblotting analysis of TAZ expression in Raw264.7 cells cocultured with cancer cell lines (HT29, MDA-MB-231, A375, HeLa, or Hs578T) for 24 hours. (F) Immunoblotting of TAZ expression in Raw264.7 cells cocultured with mouse-derived cancer cell lines (MC38, B16F10, or E0771) for 24 hours. (G) Schematic of allograft procedure where B16F10 cells were coinjected subcutaneously with Raw264.7/siCon or Raw264.7/siTaz into C57BL/6 mice and allowed to grow for 21 days. (H and I) Tumor images (H) and tumor weights (I) from B16F10 allografts coinjected with Raw264.7/siCon or Raw264.7/siTaz in C57BL/6 mice (n = 6 per group). Data were analyzed using Student’s t tests, presented as means ± SD (*P < 0.05). Scale bar, 1 cm. (J) Representative histology images showing CD8+ T cells or NK cells infiltrating tumors coinjected with Raw264.7/siCon or Raw264.7/siTaz. Black scale bar, 50 μm; white scale bar, 20 μm. (K and L) Percentage of CD8+ T cells (K) or NK cells (L) infiltrating B16F10 tumors coinjected with Raw264.7/siCon or Raw264.7/siTaz. **P < 0.01.
Fig. 7.
Fig. 7.. Role of macrophage TAZ in the inflammation and fibrosis of chronic liver disease.
(A) Experimental scheme for the CDAHFD-induced MASH model. The MASH model was generated by feeding TAZflox/flox and LysMcre; TAZflox/flox mice groups with CDAHFD for 34 weeks. ITT, insulin tolerance test; GTT, glucose tolerance test. (B and C) Insulin tolerance tests (B) and glucose tolerance tests (C) were performed on TAZflox/flox and LysMcre; TAZflox/flox groups after 16 or 18 weeks of CDAHFD, respectively. Blood glucose was measured at the indicated time points after insulin or glucose injection. n = 4 independent animals. (D to G) Serum levels of ALT (D), triglycerides (E), free fatty acids (F) and cholesterol (G) were measured in both groups after 34 weeks of CDAHFD. n = 5 independent animals. Data were analyzed using Student’s t tests and presented as means ± SD. *P < 0.05, **P < 0.01. (H) qPCR analysis of hepatic Mmp13, Timp1, and Col3a1 mRNA expression after 34 weeks of CDAHFD in both groups. n = 6. Data were analyzed using Student’s t tests. *P < 0.05, **P < 0.01. (I) qPCR analysis of hepatic Ccl2, Ccl5, H2Aa, H2Ab1, and H2Eb1 mRNA expression in the TAZflox/flox and LysMcre; TAZflox/flox groups after 34 weeks of CDAHFD. n = 5 independent animals. *P < 0.05, **P < 0.01. (J) qPCR analysis of hepatic Iit1, Ifit3, Isg15, and Stat1 mRNA expression after 34 weeks. n = 6. **P < 0.01. (K) Representative histology images of CD8+ T cells or Sirius red staining in liver tissue harvested from TAZflox/flox and LysMcre; TAZflox/flox mice. Scale bar, 50 μm. (L to N) Percentage of lipid droplets (L), CD8+ T cells (M), and Sirius red (N) in liver tissue from both groups after 34 weeks. n = 3 independent animals. Data were analyzed using Student’s t tests. *P < 0.05, ***P < 0.001.

References

    1. Zhao B., Tumaneng K., Guan K.-L., The Hippo pathway in organ size control, tissue regeneration and stem cell self-renewal. Nat. Cell Biol. 13, 877–883 (2011). - PMC - PubMed
    1. Harvey K. F., Zhang X., Thomas D. M., The Hippo pathway and human cancer. Nat. Rev. Cancer 13, 246–257 (2013). - PubMed
    1. Moon S., Yeon Park S., Woo Park H., Regulation of the Hippo pathway in cancer biology. Cell. Mol. Life Sci. 75, 2303–2319 (2018). - PMC - PubMed
    1. Totaro A., Panciera T., Piccolo S., YAP/TAZ upstream signals and downstream responses. Nat. Cell Biol. 20, 888–899 (2018). - PMC - PubMed
    1. Mo J. S., Park H. W., Guan K. L., The Hippo signaling pathway in stem cell biology and cancer. EMBO Rep. 15, 642–656 (2014). - PMC - PubMed

Substances