. 2025 Jan 24;11(4):eado3852.
doi: 10.1126/sciadv.ado3852. Epub 2025 Jan 22.

The deubiquitinase USP5 prevents accumulation of protein aggregates in cardiomyocytes

Affiliations

The deubiquitinase USP5 prevents accumulation of protein aggregates in cardiomyocytes

Yvonne Eibach et al. Sci Adv. .

Abstract

Protein homeostasis is crucial for maintaining cardiomyocyte (CM) function. Disruption of proteostasis results in accumulation of protein aggregates causing cardiac pathologies such as hypertrophy, dilated cardiomyopathy (DCM), and heart failure. Here, we identify ubiquitin-specific peptidase 5 (USP5) as a critical determinant of protein quality control (PQC) in CM. CM-specific loss of mUsp5 leads to the accumulation of polyubiquitin chains and protein aggregates, cardiac remodeling, and eventually DCM. USP5 interacts with key components of the proteostasis machinery, including PSMD14, and the absence of USP5 increases activity of the ubiquitin-proteasome system and autophagic flux in CMs. Cardiac-specific hUSP5 overexpression reduces pathological remodeling in pressure-overloaded mouse hearts and attenuates protein aggregate formation in titinopathy and desminopathy models. Since CMs from humans with end-stage DCM show lower USP5 levels and display accumulation of ubiquitinated protein aggregates, we hypothesize that therapeutically increased USP5 activity may reduce protein aggregates during DCM. Our findings demonstrate that USP5 is essential for ubiquitin turnover and proteostasis in mature CMs.


Figures

Fig. 1.
Fig. 1.. Differentially spliced isoforms of USP5 interact with parts of the PQC machinery.
(A) Scheme depicting alternative spliced transcripts of Usp5. The short isoform of Usp5 lacks 69 base pairs (bp) of exon 15. Location of primers (P1 and P2) used for semiquantitative RT-PCR are indicated by arrows. (B) RT-PCR showing spliced variants of mUsp5 in diverse, adult mouse tissues. (C) RT-PCR showing spliced variants of mUsp5 in CMs at different developmental stages (E13.5: embryonic day 13.5, neonatal and adult), adult non-CMs, and MEFs. [(B) and (C)] Gapdh was used as loading control. (D) Heatmap showing concentrations of biotinylated proteins identified in BirA*- and USP5-BirA*–transduced cells (BioID screen). Only proteins related to ubiquitin- and autophagy-related pathways are shown. Concentrations were determined by label-free quantification (LFQ). (E) Western blot analysis of cardiac markers ACTN2, cTNT, and desmin in HL-1 CMs. (F) Western blot analysis of input and coimmunoprecipitation (coIP) samples to verify selected interaction partners of endogenous USP5 in HL-1 CMs. [(E) and (F)] GAPDH or RALA was used as loading control for the input. Multiple antibodies were used to probe a single blot, allowing the repeated use of a single loading control as a reference for different reactions.
Fig. 2.
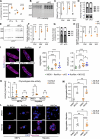
Fig. 2.. Inactivation of Usp5 increases polyubiquitin levels in CMs but not in MEFs and hepatocytes.
(A) Scheme for CM-restricted inactivation of Usp5. Eight-week-old flox/flox, MCM, and cKO mice were intraperitoneally injected for 7 days with tamoxifen (100 mg kg−1). CMs were isolated and analyzed 15 days after the last tamoxifen administration (= 11 weeks of age), while hearts were isolated and analyzed 24 days after the last tamoxifen administration (=13 weeks of age). (B and C) Immunoblotting (B) of USP5 in CMs from flox/flox, MCM, and cKO hearts and quantification (C), flox/flox (n = 7), MCM (n = 6), and cKO (n = 10). Mann-Whitney test. (D) Staining for USP5 (green) and nuclei (DAPI, blue) in CMs from flox/flox, MCM, and cKO mice. Scale bar, 20 μm. (E and F) Immunoblotting (E) and quantification (F) for ubiquitin in flox/flox (n = 6), MCM (n = 9), and cKO (n = 10) CMs with comigration of purified tri-ubiquitin (Ub3, 25 ng). (G and H) Immunoblotting (G) and quantification (H) for K48-linkage–specific ubiquitin chains in flox/flox (n = 4), MCM (n = 5), and cKO (n = 6) CMs with comigration of purified K48-linkage–specific polyubiquitin chains 1 to 7 [K48(1–7), 25 ng]. [(F) and (H)] Welch’s unequal variances t test. (I and J) Immunoblotting (I) and quantification (J) for ubiquitin in primary non-CM, MEFs, and hepatocytes (Hepatos) after Ad-Null or Ad-Cre transduction (n ≥ 3). (K and L) Immunoblotting (K) and quantification (L) for USP5 non-CMs, MEFs, and hepatocytes after Ad-Null or Ad-Cre transduction (n ≥ 3). [(I) and (K)] After probing non-CMs and hepatocytes for ubiquitin and the GAPDH loading control, the same membrane was reprobed with anti-USP5 antibodies. [(J) and (L)] Two-way ANOVA with Sidak’s multiple comparison test. [(E) and (G)] Ub3 and K48(1–7) controls were exposed shorter than the samples. Ubiquitin levels normalized to total protein. [(B), (I), and (K)] GAPDH was used as a loading control. **P ≤ 0.01; ***P ≤ 0.001.
Fig. 3.
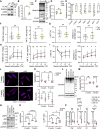
Fig. 3.. Deletion of Usp5 results in imbalanced proteasomal activity and accumulation of protein aggregates in CMs but not in MEFs or hepatocytes.
(A) Chymotrypsin-like (CT-L), trypsin-like (T-L), and caspase-like (C-L) activities in extracts of WT and cKO isolated CMs (n = 4), using catalytic site–specific substrates (GLO assay). (B and E) Native gel analysis of the same samples. (B) In-gel CT-L proteasome activity of Usp5-deficient and WT CMs (n = 4). (C and D) Quantification of CT-L activity (B) of proteasome complexes [30S, 26S, and 20S; (C)] and ratios (D). (E) Abundance of distinct proteasome complexes, determined by blotting of the native gel for α1 to α7 proteasome subunits in WT and cKO isolated CMs (n = 4). (F and G) Quantification of 30S, 26S, and 20S abundances in (F) and relative distribution (G) in WT and cKO CMs. (H) Specific activity of proteasome complexes (activity/abundance). (I) Staining for ubiquitin (magenta) and nuclei (DAPI, blue) in CMs of different groups as indicated. Scale bar, 50 μm. (J) Number and size of protein aggregates in flox/flox (n = 4), MCM (n = 5), and cKO (n = 5) CMs and flox/flox CMs treated with MG132 (n = 4). Two-way ANOVA with Dunn’s multiple comparison test. [(A) to (J)] WT mice received no tamoxifen treatment. (K) CT-L activity in MEFs and hepatocytes after Ad-Null or Ad-Cre transduction and with or without MG132 treatment. Ad-Null: MEFs n = 7, hepatocytes n = 4; Ad-Cre: MEFs n = 8, hepatocytes n = 4. [(A), (C), (F), (H), and (K)] Two-way ANOVA with Sidak’s multiple comparison test. (L) ProteoStat staining (magenta) and nuclei (DAPI, blue) in MEFs and hepatocytes after Ad-Null or Ad-Cre transduction, treated with or without MG132. Scale bar, 25 μm. (M) Number of protein aggregates in MEFs (n = 4) and hepatocytes (n = 3 to 8) after Ad-Null or Ad-Cre transduction and treatment with or without MG132. (M) Two-way ANOVA with Tukey’s multiple comparison test. *P ≤ 0.05; **P ≤ 0.01; ***P ≤ 0.001, ****P ≤ 0.0001.
Fig. 4.
Fig. 4.. Loss of Usp5 increases autophagic flux in CMs.
(A) Immunoblotting for K63-linkage–specific ubiquitin chains in MCM, flox/flox, and cKO CMs with comigration of purified K63-linkage–specific polyubiquitin chains 1 to 7 [K63(1–7), 25 ng, separated by a single lane, shown at a lower exposure time compared to the samples]. (B) Levels of K63-polyubiquitin chains normalized to total protein in flox/flox (n = 5), MCM (n = 4), and cKO (n = 6) CMs. (C) Immunoblotting for p62 and LC3I/II in CMs with the indicated genotypes without treatment. (D) p62 protein levels normalized to GAPDH in flox/flox (n = 11), MCM (n = 8), and cKO (n = 11) CMs. (E) Quantification of the LC3I/II ratio in CMs with the indicated genotypes (n = 11). Mann-Whitney test. (F) Immunoblotting for p62 and LC3I/II in flox/flox, MCM, and cKO CMs treated with either DMSO or bafilomycin A1 (BafA). (G) p62 protein levels normalized to GAPDH in flox/flox, MCM, and cKO CMs treated with DMSO or bafilomycin A1 (n = 6). (H) LC3I/II ratio in CMs with the indicated genotypes treated with either DMSO or bafilomycin A1 (n = 6). [(G) and (H)] Two-way ANOVA with Sidak’s multiple comparison test. (I) Normalized LC3II flux assessed by subtracting LC3II protein levels (normalized to GAPDH) in bafilomycin A1–treated versus DMSO-treated CMs (n = 6). [(B), (D), and (I)] Welch’s unequal variances t test. (J) Immunoblotting for p62 and LC3I/II in CMs with the indicated genotypes treated with either DMSO or chloroquine (CQ). (K) Immunoblotting for (cleaved) caspase-3 in untreated MCM, flox/flox, and cKO CMs. (L) Ratio of cleaved caspase-3 to total caspase-3 in MCM, flox/flox, and cKO CMs (n = 3). Unpaired t test. [(A), (C), (F), (J), and (K)] GAPDH was used as a loading control. *P ≤ 0.05; **P ≤ 0.01; ***P ≤ 0,001; ****P ≤ 0.0001.
Fig. 5.
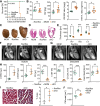
Fig. 5.. Absence of Usp5 in CMs causes DCM in mice.
(A) Kaplan-Meier survival curve of mice with the indicated genotypes after tamoxifen administration. cKO (n = 8) died within 2 to 3 days, beginning 24 days after the last tamoxifen injection. None of the control mice (MCM and flox/flox) died after injection of tamoxifen for seven consecutive days. (B) Effect of CM-specific Usp5 deletion on body weight (BW), heart weight (HW), and heart weight to body weight (HW:BW) and heart weight to tibia length (HW:TL) ratio in flox/flox (n = 9), MCM (n = 5), and cKO (n = 10) mice. (C and D) Representative heart images (C) and H&E-stained heart cross sections of (D). Scale bar, 1000 μm. (E) Analysis of myocardial wall thickness (based on H&E-stained cross sections) of hearts from flox/flox (n = 6), MCM (n = 5), and cKO (n = 7) mice. RV, right ventricle; IVS, intraventricular septum; LV, left ventricle. Two-way ANOVA with Sidak’s multiple comparison test. (F and G) Long-axis views of end-systole (F) and end-diastole (G) of hearts from mice with the indicated genotypes. (H) Quantification of cardiac parameters in flox/flox (n = 4), MCM (n = 5), and cKO (n = 5) mice by MRI. ESV, end-systolic volume; EDV, end-diastolic volume; SV, stroke volume; LVEF, left ventricular ejection fraction; CO, cardiac output; HR, heart rate. (I) Masson’s trichrome staining of myocardial cross sections from cKO and littermate controls and corresponding quantifications (n = 4). Scale bar, 20 μm. (J) Quantification of the size of CMs from flox/flox (n = 4), MCM (n = 4), and cKO (n = 4) (for representative images, see Fig. 2D). [(B) and (H) to (J)] Welch’s unequal variances t test. For Fig. 5, only male mice were analyzed. *P ≤ 0.05; **P ≤ 0.01; ***P ≤ 0.001.
Fig. 6.
Fig. 6.. End-stage DCM in humans is characterized by reduced USP5 levels and increased ubiquitin-conjugated protein aggregates.
(A) Staining for protein aggregates (ProteoStat, magenta), F-actin (gray), and nuclei (DAPI, blue) in cross-sectioned hearts from control and DCM persons. Scale bar, 30 μm. (B) Number and size of protein aggregates in control (n = 4) and DCM (n = 5) hearts. (C) Staining for ubiquitin (magenta), F-actin (gray), and nuclei (DAPI, blue) in cross-sectioned hearts from control and DCM individuals. Scale bar, 50 μm. (D) Percent of CMs containing ubiquitin-positive aggregates and corresponding size in hearts of control (n = 4) and DCM (n = 5) individuals. (E and F) Immunoblotting (E) and corresponding quantification (F) for ubiquitin in hearts from control (n = 4) and DCM (n = 6) individuals normalized to GAPDH. (G) Staining for USP5 (green), F-actin (gray), and nuclei (DAPI, blue) in heart cross sections from control and DCM individuals. Scale bar, 30 μm. (H) Percentage of USP5-positive CMs in control (n = 4) and DCM (n = 5) myocardium. (I and J) Immunoblotting of control and DCM hearts (I) and corresponding quantification (J) for USP5 in lysates from control (n = 6) and DCM hearts (n = 17) normalized to GAPDH. [(B), (D), (F), (H), and (J)] Welch’s unequal variances t test. (K) RT-PCR analysis of hUSP5 splice variants in human control and DCM myocardium. GAPDH was used as loading control. (L) Quantification of short and long hUSP5 in control (n = 11) and DCM (n = 23) myocardium, normalized to GAPDH. One-way ANOVA. (M) RT-qPCR of hUSP5 exon boundaries 6 to 7 and exons 15 and 16 in control (n = 6) and DCM (n = 17) myocardium, normalized to GAPDH. Mann-Whitney test. [(E) and (I)] GAPDH was used as a loading control. *P ≤ 0.05; **P ≤ 0.01.
Fig. 7.
Fig. 7.. Overexpression of USP5 attenuates pressure overload–induced cardiac hypertrophy.
(A and B) Immunoblotting (A) and quantification (B) for USP5 in Cre and cOE CMs (n = 5). (C and D) Immunoblotting (C) and quantification (D) for ubiquitin in WT (n = 6), Cre (n = 3), and cOE (n = 6) CMs. The same membrane was reprobed with anti-FLAG and anti-GAPDH antibodies. (E) RT-qPCR analysis of hUSP5, mUsp5, and stress-response genes in Cre and cOE CMs (n = 3). Two-way ANOVA with Sidak’s multiple comparison test. (F and G) Heart function parameters in Cre (n = 14) and OE (n = 12) mice. Ventricular mass to body weight (VM:BW) and ventricular mass to tibia length (VM:TL) ratios (F), left ventricular ejection fraction (LVEF), and diastolic left ventricular (LV) diameter (G). (H to P) TAC surgeries were conducted with mice aged 14 ± 1 weeks. Control (n = 9, 5 females, 4 males), cOE (n = 8, 5 females, 3 males). [(H) and (I)] The cardiac function was monitored using MRI at −1, 1, 2, and 4 weeks relative to surgery: VM:BW and VM:TL ratios (H) and LVEF and LV diameter (I) (n ≤ 9). Mixed-effect analysis with Tukey’s multiple comparison test. [(J) to (P)] Molecular analyses were performed 2 and 5 weeks after TAC surgery. [(J) and (K)] ProteoStat staining (J) for aggregates (magenta) and nuclei (DAPI, blue) and number and size of protein aggregates in control and cOE CMs (n = 4). [(L) to (P)] Immunoblotting [(L) and (N)] and quantification [(M), (O), and (P)] for ubiquitin, USP5, p62, and LC3 levels in control and cOE CMs (n = 4). (P) RT-qPCR analysis of fibrosis marker genes in non-CMs from control and cOE hearts (2 weeks, n = 3; 5 weeks, n = 6). [(A), (C), (L), and (N)] GAPDH was used as a loading control. [(B), (D), (F), and (G)] Mann-Whitney test. [(K), (M), (O), and (P)] Two-way ANOVA with Tukey’s multiple comparison test. *P ≤ 0.05; **P ≤ 0.01; ***P ≤ 0.001, ****P ≤ 0.0001.
Fig. 8.
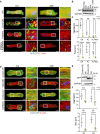
Fig. 8.. Augmented expression of USP5 abolishes mutant titin-containing protein aggregates in CMs.
(A) Staining for GFP-titin (green), F-actin (red), and nuclei (DAPI, blue) of CMs transduced with an adenovirus encoding WT titin and HMERF-linked mini-titins C31712R (CR), P30091L (PL), and P30091L + R32450W (PL + RW). Magnification of marked image sections is shown next to it. Scale bar, 25 μm. (B) Protein levels of GFP-tagged HMERF-linked mini-titins determined by immunoblotting. (C) Number and size of GFP-positive aggregates in Cre and cOE CMs (n = 5). (D) Staining for GFP-titin (green), F-actin (red), and nuclei (DAPI, blue) in CMs transduced with an adenovirus encoding DCM-linked mini-titins p.Val22232Glu (VE), p.Gly27849Val (GV), and corresponding controls. Magnification of marked image sections is shown. Scale bar, 25 μm. (E) Immunoblot analysis of GFP-tagged DCM-linked mini-titin protein levels. (F) Number and size of GFP-positive aggregates in Cre and cOE CMs (n = 5). [(C) and (F)] Two-way ANOVA with Tukey’s multiple comparison test. [(B) and (E)] GAPDH was used as a loading control. **P ≤ 0.01; ***P ≤ 0.001, ****P ≤ 0.0001.
Fig. 9.
Fig. 9.. Elevated expression of USP5 restores PQC defects in CMs expressing mutant desmin.
(A to D) Immunoblotting and corresponding quantifications for USP5 [(A) and (B)] and desmin [(C) and (D)] in CMs of Control-Des (n = 4), DesR349P (n ≥ 6), and DesR349P:USP5 (n ≥ 5) mice normalized to GAPDH. (E) Staining for protein aggregates (ProteoStat, cyan) and nuclei (DAPI, blue) in CMs with the indicated genotypes. Scale bar, 25 μm. (F) Number of protein aggregates in Control-Des (n = 4), Des-R349P (n = 5), and DesR349P:USP5 (n = 4) CMs. (G) Immunoblotting for ubiquitin in Control-Des, DesR349P, and DesR349P:USP5 CMs. (H) Ubiquitin levels in Control-Des, DesR349P, and DesR349P:USP5 CMs (n = 4, each). (I) Chymotrypsin-like activity in control (n = 8), cOE (n = 3), R349P-Des (n = 5), and R349P-Des:USP5 (n = 5) CMs determined using AMC. Control groups include Control-Des (n = 3) and Cre (n = 5). (J and L) Immunoblotting for p62 (J) and LC3 (L) in Control-Des, DesR349P, and DesR349P:USP5 CMs. (K and M) Protein levels of p62 (K) and LC3I/II ratio (M) normalized to GAPDH in CMs of Control-Des (n = 4), DesR349P (n = 5), and DesR349P:USP5 (n = 4) mice. [(A), (C), (G), (J), and (L)] GAPDH served as a loading control. [(B), (D), (F), (H), (I), (K), and (M)] One-way ANOVA with Tukey’s multiple comparison test. *P ≤ 0.05; **P ≤ 0.01; ***P ≤ 0.001.
Fig. 10.
Fig. 10.. Schematic representation of the effects of USP5 in PCQ of CMs.
Model of the role of USP5 in cardiac PQC. Schematic representation of the effects of USP5 inactivation on proteostasis in CMs. (Left) At steady state, USP5 maintains PQC and proteostasis by the disassembly of free polyubiquitin chains. (Right) Loss of USP5 in CMs alters PQC due to an imbalance in the ubiquitin pool, which increases autophagy and proteasome activity, resulting in elevated protein aggregation. (Bottom) Augmented expression of USP5 abolishes protein aggregates in CMs after pressure overload or in proteinopathies.

Similar articles

Cited by

References

    1. Kim Y. E., Hipp M. S., Bracher A., Hayer-Hartl M., Hartl F. U., Molecular chaperone functions in protein folding and proteostasis. Annu. Rev. Biochem. 82, 323–355 (2013). - PubMed
    1. McLendon P. M., Robbins J., Proteotoxicity and cardiac dysfunction. Circ. Res. 116, 1863–1882 (2015). - PMC - PubMed
    1. Kwon Y. T., Ciechanover A., The ubiquitin code in the ubiquitin-proteasome system and autophagy. Trends Biochem. Sci. 42, 873–886 (2017). - PubMed
    1. Tannous P., Zhu H., Nemchenko A., Berry J. M., Johnstone J. L., Shelton J. M., Miller F. J. Jr., Rothermel B. A., Hill J. A., Intracellular protein aggregation is a proximal trigger of cardiomyocyte autophagy. Circulation 117, 3070–3078 (2008). - PMC - PubMed
    1. Chiti F., Dobson C. M., Protein misfolding, amyloid formation, and human disease: A summary of progress over the last decade. Annu. Rev. Biochem. 86, 27–68 (2017). - PubMed

MeSH terms

LinkOut - more resources