. 2025 Jan 24;11(4):eadq7307.
doi: 10.1126/sciadv.adq7307. Epub 2025 Jan 22.

Mitochondrial respiratory complex III sustains IL-10 production in activated macrophages and promotes tumor-mediated immune evasion

Affiliations

Mitochondrial respiratory complex III sustains IL-10 production in activated macrophages and promotes tumor-mediated immune evasion

Alessia Zotta et al. Sci Adv. .

Abstract

The cytokine interleukin-10 (IL-10) limits the immune response and promotes resolution of acute inflammation. Because of its immunosuppressive effects, IL-10 up-regulation is a common feature of tumor progression and metastasis. Recently, IL-10 regulation has been shown to depend on mitochondria and redox-sensitive signals. We have found that Suppressor of site IIIQo Electron Leak 1.2 (S3QEL 1.2), a specific inhibitor of reactive oxygen species (ROS) production from mitochondrial complex III, and myxothiazol, a complex III inhibitor, decrease IL-10 in lipopolysaccharide (LPS)-activated macrophages. IL-10 down-regulation is likely to be mediated by suppression of c-Fos, which is a subunit of activator protein 1 (AP1), a transcription factor required for IL-10 gene expression. S3QEL 1.2 impairs IL-10 production in vivo after LPS challenge and promotes the survival of mice bearing B16F10 melanoma by lowering tumor growth. Our data identify a link between complex III-dependent ROS generation and IL-10 production in macrophages, the targeting of which could have potential in boosting antitumor immunity.


Figures

Fig. 1.
Fig. 1.. Characterization of complex III inhibitors in macrophages.
(A) S3QEL 1.2 chemical structure. (B and C) Rate of relative resorufin fluorescence units (rRFUs) directly proportional to H2O2 production in the presence of DMSO, S3QEL 1.2 (10 μM), and MYX (500 nM) (B) or DMSO, MitoTempo (5 mM), and LPS (100 ng/ml) (C) for 48 hours in BMDMs. NS, not stimulated. (D to F) BMDMs were pretreated with DMSO, MYX (500 nM), or S3QEL 1.2 (10 μM) for 3 hours followed by LPS (100 ng/ml) for 24 hours. Mito Stress Test showing OCR of cells after addition of oligo, FCCP, and rotenone (Rot)/AA (D). Maximal respiration (E) and spare respiratory capacity (F) calculated from the OCR values. (G to I) Mito Stress Test showing OCR of cells after treatment with S3QEL 1.2 (0.1, 1, or 10 μM) (G), MYX (50, 500, or 5000 nM) (H), or AA (50, 500, or 5000 nM) (I) and addition of oligo, FCCP, and rotenone/AA. UNTR, untreated. (J to K) BMDMs were pretreated with DMSO, MYX (500 nM), or S3QEL 1.2 (10 μM) for 3 hours followed by LPS (100 ng/ml) for 24 hours. Metabolic flux analysis showing complex III (CIII)–specific OCR of cells over time after addition of ADP + duroquinol, oligo, and AA. (K) Quantification of complex III–specific OCR. Data in (B) are means ± SEM for n = 3 from three independent experiments. Data in (C) are means ± SEM for n = 5 from five independent experiments. Data from (D) to (F) are means ± SEM from three independent experiments, with n = 7 to 12 technical replicates for each condition. Data from (G) to (I) are means ± SEM from two independent experiments, with n = 9 technical replicates for each condition. Data from (J) to (K) are means ± SEM from three independent experiments, with n = 12 technical replicates for each condition. P values were calculated using one-way ANOVA for multiple comparisons. Differences were statistically significant at **P < 0.01, ***P < 0.001, and ****P < 0.0001.
Fig. 2.
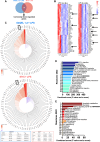
Fig. 2.. Complex III inhibition reveals a specific transcriptional signature in activated macrophages.
(A to E) RNA sequencing of LPS-primed mouse macrophages (BMDMs) and pretreated (3 hours) with DMSO, S3QEL 1.2 (10 μM), and MYX (500 nM). (A) Venn diagram of commonly differentially expressed genes (146) between S3QEL 1.2 + LPS versus LPS and MYX + LPS versus LPS [adjusted P (Padj) < 0.1]. (B) Heatmap of the top 100 commonly up-regulated genes by LPS alone (red column) and down-regulated by both MYX and S3QEL 1.2 after LPS priming (second and third columns; in blue). hrs, hours. (C) IREA of differentially down-regulated genes by S3QEL 1.2 (top) and MYX (down) after LPS stimulation [adjusted P (Padj) < 0.05]. (D) and (E) GSEA of differentially regulated genes. (D) Overrepresentation analysis of RNA-seq data of BMDMs pretreated with S3QEL 1.2 or MYX (n = 3 from one independent experiment; LPS, 4 hours). Reactome pathway enrichment analysis of differentially down-regulated genes. (E) Overrepresentation analysis of RNA-seq data of BMDMs pretreated with S3QEL 1.2 or MYX (n = 3 from one independent experiment; LPS, 4 hours). Reactome pathway enrichment analysis of differentially up-regulated genes.
Fig. 3.
Fig. 3.. The inhibition of complex III decreases LPS-induced IL-10 expression in macrophages.
(A to D) BMDMs were pretreated with DMSO or S3QEL 1.2 (0.1 to 10 μM) for 3 hours before LPS (100 ng/ml) stimulation for 4 hours, and cell lysates and supernatants were harvested. (A) and (B) Quantification of IL-10 mRNA (A) and released protein (B) by RT-qPCR, relative to the Rps18 housekeeping gene, and ELISA. (C) and (D) Quantification of TNF-α mRNA (C) and released protein (D) by RT-qPCR, relative to the Rps18 housekeeping gene, and ELISA. FC, fold change. (E to H) BMDMs were pretreated with DMSO and MYX (500 nM) for 3 hours before LPS (100 ng/ml) stimulation for 4 hours, and cell lysates and supernatants were harvested. (E) and (F) Quantification of IL-10 mRNA (E) and released protein (F) by RT-qPCR, relative to the Rps18 housekeeping gene, and ELISA. (G) and (H) Quantification of TNF-α mRNA (G) and released protein (H) by RT-qPCR, relative to the Rps18 housekeeping gene, and ELISA. (I) Schematic diagram of in vivo procedure and sample collection. Mice were intraperitoneally (ip) injected with PBS or S3QEL 1.2 (1 mg/kg) for 2 hours, followed by LPS (2.5 mg/kg) for 2 hours. Blood (then serum) was collected. hrs, hours. (J) Quantification of IL-10 by ELISA in the serum. Data from (A) to (H) are expressed as means ± SEM for n = 5 to 9 from three independent experiments. Data from (J) are expressed as means ± SEM (n = 10 per group within two independent in vivo experiments). P values were calculated using one-way ANOVA for multiple comparisons. Differences were considered statistically significant at *P < 0.05, **P < 0.01, ***P < 0.001, and ****P < 0.0001.
Fig. 4.
Fig. 4.. Complex III–dependent IL-10 regulation is mediated by the c-Fos subunit of the AP1 transcription factor.
(A and B) Overrepresentation analysis of RNA-seq data of BMDMs pretreated with SQ3EL 1.2 or MYX (data are from n = 3 from one independent experiment; LPS, 4 hours). (A) EnrichR transcription factor enrichment analysis of differentially down-regulated genes. (B) Heatmap of significantly down-regulated AP1 target genes with adjusted P (Padj) < 0.05. (C and D) BMDMs were pretreated with DMSO, MYX (500 nM), or S3QEL 1.2 (10 μM) for 1 hour before LPS (100 ng/ml) stimulation for 0 to 120 min, and cell lysates were harvested. Quantification of c-Fos mRNA by RT-qPCR, relative to the Rps18 housekeeping gene, in BMDMs pretreated with S3QEL 1.2 (C) or MYX (D) and stimulated with LPS. (E and F) Confocal microscopy images (E) and quantification (F) of BMDMs pretreated with DMSO, MYX (500 nM), or S3QEL 1.2 (10 μM) for 1 hour before LPS (100 ng/ml) stimulation for 2 hours. After that, cells were fixed and stained for phospho-c-Fos to assess cellular localization. Merge depicts phospho-c-Fos (red) together with nuclear staining (DAPI). Data in (C) and (D) are means ± SEM for n = 5 from three independent experiments. Data in (F) are means ± SD from one of the experiments in (E), showing the activated cells giving a fluorescence signal. Confocal images are representative of two independent experiments. P values were calculated using one-way ANOVA for multiple comparisons. Differences were considered statistically significant at **P < 0.01, ***P < 0.001, and ****P < 0.0001.
Fig. 5.
Fig. 5.. S3QEL 1.2 administration ameliorates survival and inhibits melanoma progression in mice in vivo.
(A) BMDMs were pretreated with DMSO, MYX (500 nM), or S3QEL 1.2 (10 μM) for 3 hours, stimulated with CpG (1 μg/ml) for 4 hours, and cell lysates and supernatants were harvested. Quantification of IL-10 mRNA by RT-qPCR, relative to the Rps18 housekeeping gene, and of IL-10 levels by ELISA. (B) Schematic diagram of the melanoma in vivo model. Mice were challenged with 5 × 10⁶ B16F10 cells subcutaneously and administered with PBS, S3QEL 1.2 (1 mg/kg), and/or CpG (2.5 mg/kg). Tumors were measured daily. D, day. (C) Mean initial tumor growth curve relative to tumor volume from day −1 to day 8. (D) Kaplan-Meier survival graph up to day 65 (end of experiment). (E) Tumor growth rate curve relative to tumor area from day 0 to day 17. (F to H) Immune cells infiltrating the tumor were analyzed by flow cytometry. Cells expressing the surface markers Ly6C, F4/80, and CD11b showing the percentage of MHCII+ macrophages and mean fluorescence intensity (MFI) of MHCII (F), the percentage of CD206+ macrophages and MFI of CD206 (G), and the percentage of IL-10+ macrophages and MFI of IL-10 (H). Data from (A) are means ± SEM for n = 5 from three independent experiments. Data from (C) and (D) are means ± SEM for n = 5 for the PBS group, n = 6 for the S3QEL 1.2 group, n = 7 for the CpG group, and n = 6 for the S3QEL 1.2 + CpG group. Statistical significance for survival analysis was determined by Mantel-Cox test. Statistical significance for tumor growth analysis was determined by two-way ANOVA; asterisks are for P < 0.05 in the group’s comparison. Data from (E) to (H) are means ± SD for n = 9 from one independent in vivo experiment. P values were calculated using two-tailed unpaired Student’s t test. Differences were statistically significant at *P < 0.05, **P < 0.01, ***P < 0.001, and ****P < 0.0001.

References

    1. Kelly B., O’Neill L. A., Metabolic reprogramming in macrophages and dendritic cells in innate immunity. Cell Res. 25, 771–784 (2015). - PMC - PubMed
    1. Russell D. G., Huang L., VanderVen B. C., Immunometabolism at the interface between macrophages and pathogens. Nat. Rev. Immunol. 19, 291–304 (2019). - PMC - PubMed
    1. Fiorentino D. F., Bond M. W., Mosmann T. R., Two types of mouse T helper cell. IV. Th2 clones secrete a factor that inhibits cytokine production by Th1 clones. J. Exp. Med. 170, 2081–2095 (1989). - PMC - PubMed
    1. Saraiva M., O’Garra A., The regulation of IL-10 production by immune cells. Nat. Rev. Immunol. 10, 170–181 (2010). - PubMed
    1. Taylor A., Verhagen J., Blaser K., Akdis M., Akdis C. A., Mechanisms of immune suppression by interleukin-10 and transforming growth factor-β: The role of T regulatory cells. Immunology 117, 433–442 (2006). - PMC - PubMed

MeSH terms