. 2025 Jan 24;11(4):eadr8243.
doi: 10.1126/sciadv.adr8243. Epub 2025 Jan 22.

Microplastics in the bloodstream can induce cerebral thrombosis by causing cell obstruction and lead to neurobehavioral abnormalities

Affiliations

Microplastics in the bloodstream can induce cerebral thrombosis by causing cell obstruction and lead to neurobehavioral abnormalities

Haipeng Huang et al. Sci Adv. .

Abstract

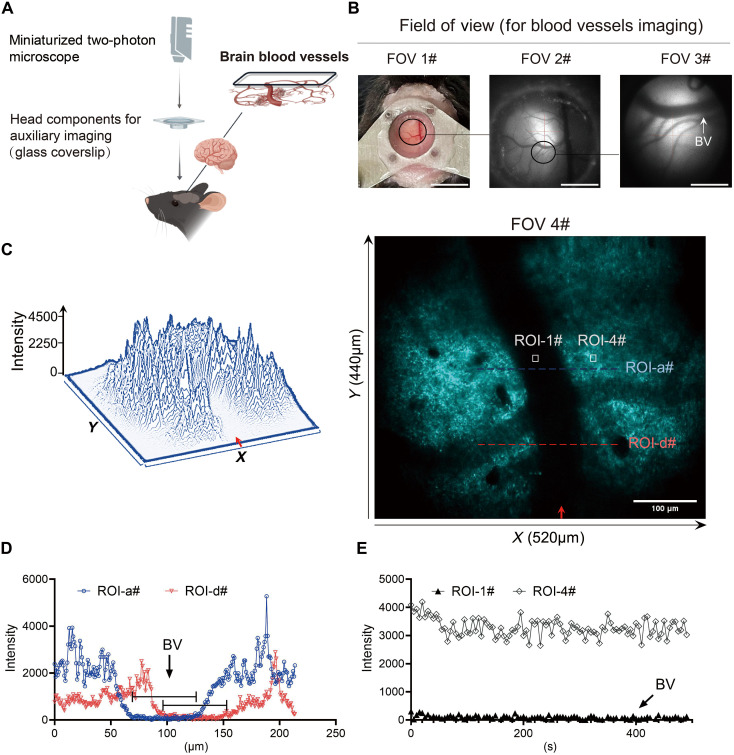
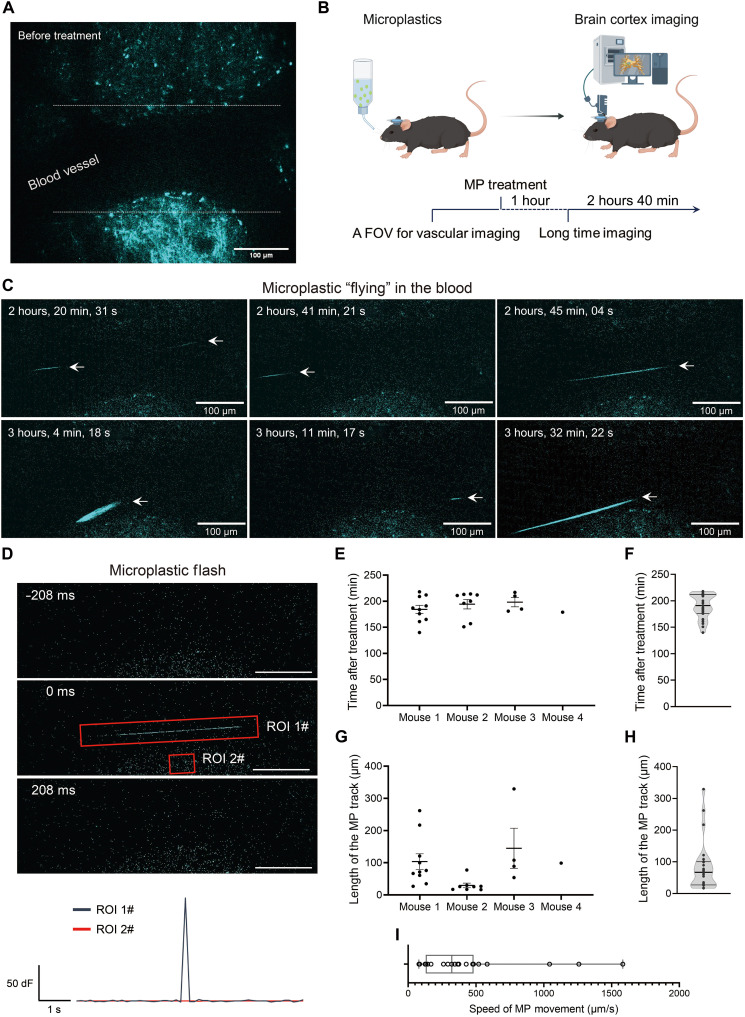
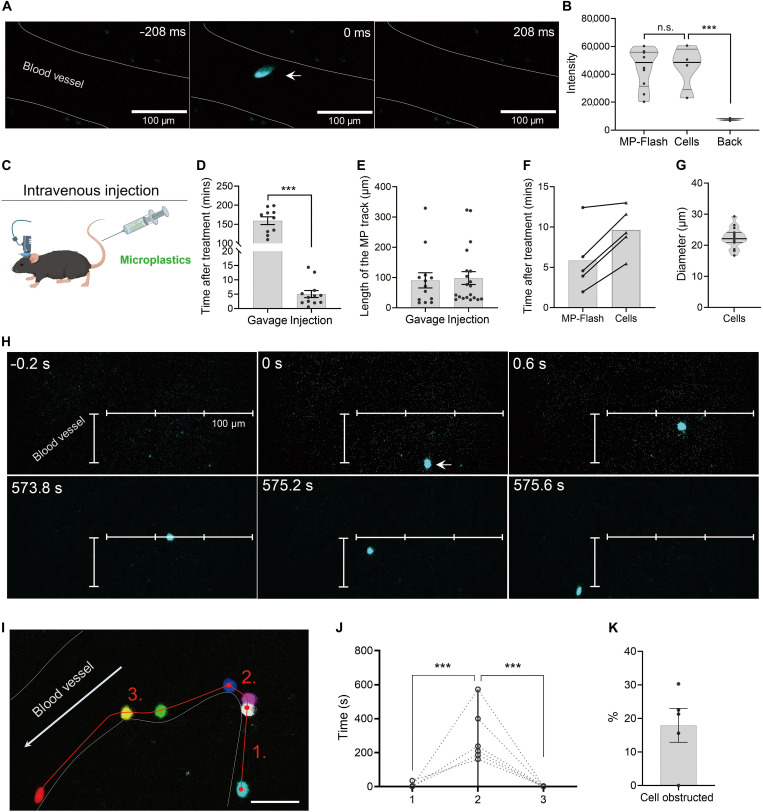
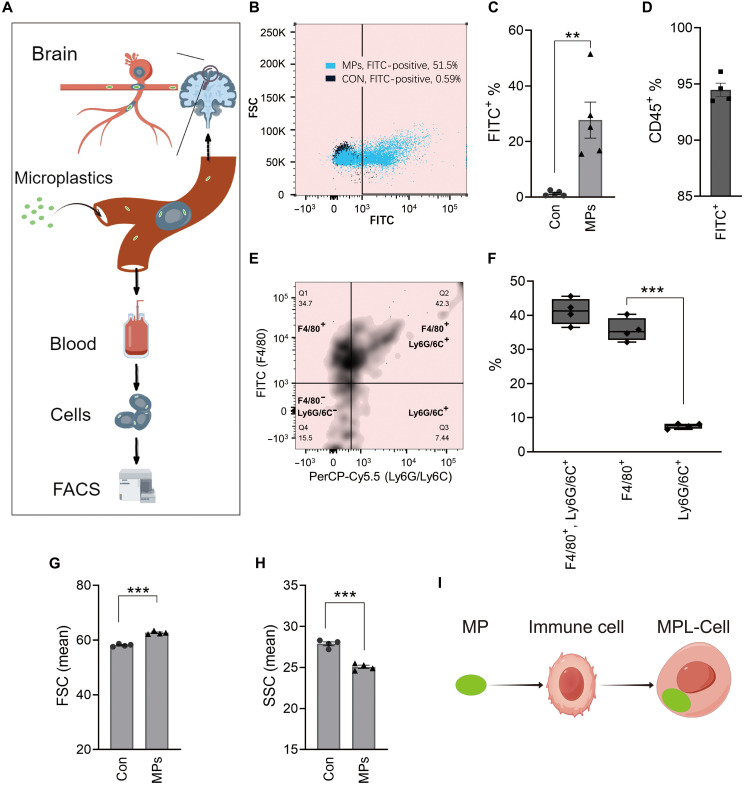
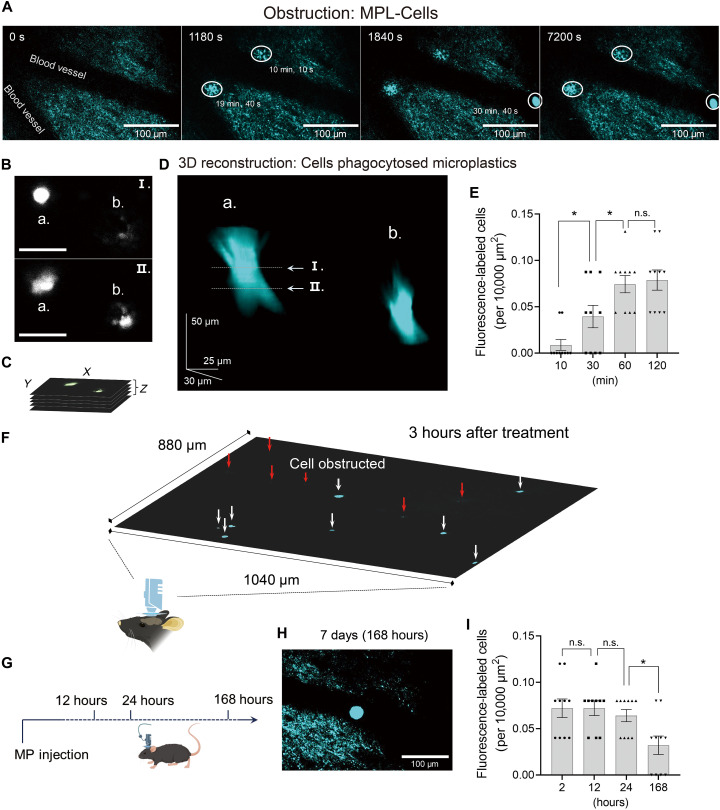
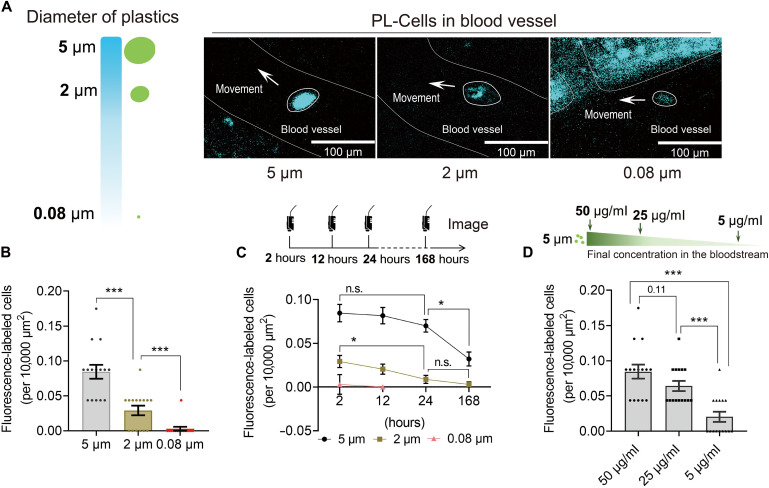
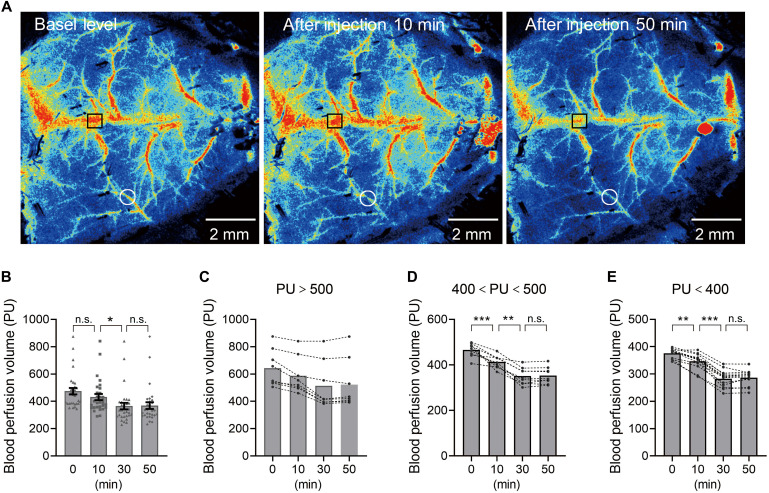
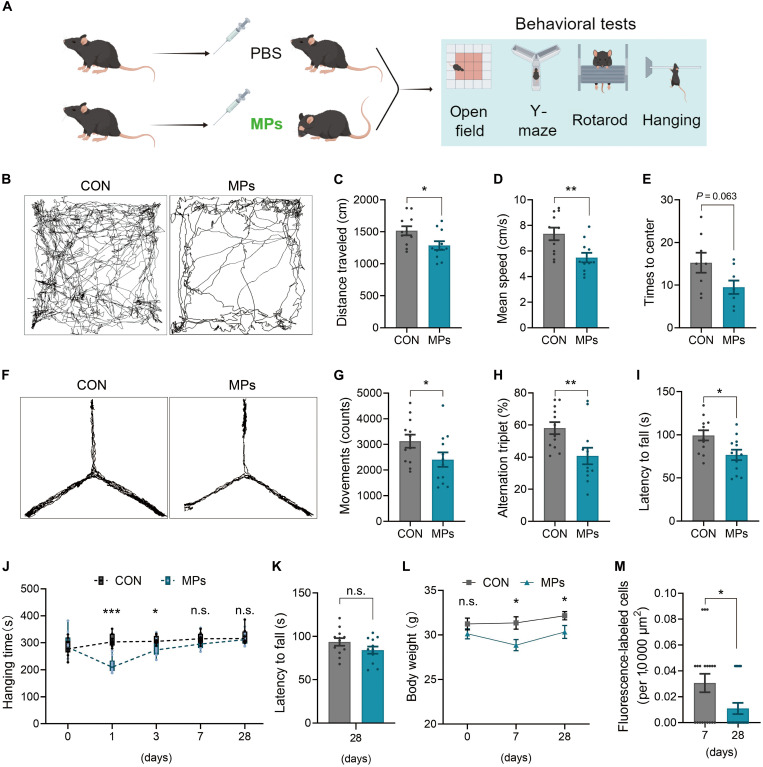
Human health is being threatened by environmental microplastic (MP) pollution. MPs were detected in the bloodstream and multiple tissues of humans, disrupting the regular physiological processes of organs. Nanoscale plastics can breach the blood-brain barrier, leading to neurotoxic effects. How MPs cause brain functional irregularities remains unclear. This work uses high-depth imaging techniques to investigate the MPs within the brain in vivo. We show that circulating MPs are phagocytosed and lead these cells to obstruction in the capillaries of the brain cortex. These blockages as thrombus formation cause reduced blood flow and neurological abnormalities in mice. Our data reveal a mechanism by which MPs disrupt tissue function indirectly through regulation of cell obstruction and interference with local blood circulation, rather than direct tissue penetration. This revelation offers a lens through which to comprehend the toxicological implications of MPs that invade the bloodstream.


Figures

Fig. 1.
Fig. 1.. Blood vessels exhibit strong contrast and weak fluorescence signals in brain cortex imaging by using two-photon microscopy in living mice.
(A) Schematic imaging representation by miniaturized two-photon microscopy to cortical blood vessels (BV). Created using FigDraw.com. (B) Fields of view (FOVs) of the blood vessels: FOV1#, bright field (scale bar, 1 cm); FOV2#, 488-nm single-photon excitation (scale bar, 250 mm); FOV3#, 488-nm single-photon excitation (scale bar, 100 mm); and FOV4#, 920-nm two-photon excitation (scale bar, 100 μm, a red arrow indicates the location of blood vessel). (C) Three-dimensional (3D) mapping of fluorescence signals within the FOV 4#. (D) Fluorescence signal detections for regions of interest (ROIs) a# and d#. (E) The fluorescence signal is recorded over a long period for fluorescence signal detections for ROIs 1# and 4#.
Fig. 2.
Fig. 2.. MPs were detected in the imaging of cerebral blood vessels in vivo.
(A) A suitable FOV for vascular imaging. (B) Schematic representation of the treatment and imaging design of the mice. Created using FigDraw.com. (C) Captured MP-Flash images; this FOV is the rectangular FOV framed by the dashed line in (A) (scale bar, 100 μm). (D) The emergence of an MP-Flash is demonstrated; ROI 1# represents the MP-Flash, and the peak of wave that exhibits a fluorescent signal is present; ROI 2# represents the background control, no fluctuation in fluorescence value. (E and F) Comparison of the time of MP-Flash appearance (n = 10 from mouse 1, n = 8 from mouse 2, n = 4 from mouse 3, and n = 1 from mouse 4) (E), and the median time of the MP-Flash occurrence (F). (G and H) Comparison of the length of the MP-Flash track (G), and the median length of the MP-Flash track (H). (I) Calculated MP-Flash running speed (n = 23 from four mice). Data are represented as means ± SEM.
Fig. 3.
Fig. 3.. Circulating MPs are phagocytosed by cells in the blood.
(A) A representative fluorescent signal labeled cell. (B) Quantitative comparison of fluorescence signals (n = 10 MP-Flash, n = 4 fluorescent signal labeled cells, and n = 10 background ROIs) (three independent replicated experiments verified the result). (C) Schematic representation of the intravenous injection in mice. Created using FigDraw.com. (D and E) Comparison of MP-Flash emergence times (n = 10 to 12 from three mice) (D) and lengths (n = 13 to 20 from three mice) (E) between the two treatments. (F) Comparison of the time of appearance of MP-Flash and the time of appearance of fluorescence-labeled cells after injection (n = 5 experiments from five mice). (G) Diameter statistics for fluorescence-labeled cells (n = 15 from four mice). (H) A trajectory of a fluorescence-labeled cell and the corresponding time. (I) The movement trajectory can be labeled as three motion processes. (J) Statistical analysis of the time taken by the three processes for equal events (n = 6 events from four mice). (K) Percentage of labeled cells that are consistently obstructed (n = 5 FOVs from five mice). Data are represented as means ± SEM. ***P < 0.001. n.s., not significant.
Fig. 4.
Fig. 4.. Fluorescent MPL-Cells were sorted and characterized.
(A) Schematic representation of the MPL-Cells in cerebral vessels, isolation, and characterization. Created using FigDraw.com. (B) Representative fluorescence-activated cell sorting (FACS) analysis plots for fluorescein isothiocyanate (FITC)–positive cells. (C) Quantification of FITC-positive cells (n = 5 mice for each group, more than 1 × 10⁵ cells were counted per sample). (D) Percentage of CD45-positive cells among FITC-positive cells in MP-treated mice (n = 4 mice). (E and F) FACS analysis plots (E) and quantification (F) for the F4/80-positive and Ly6G/Ly6C-positive cells (n = 4 mice). (G and H) analysis of the FSC (G) and SSC (H) in the MP-labeled neutrophils and control. (I) Illustration of the effects of phagocytosis of plastic microspheres on cell morphology. Data are represented as means ± SEM. **P < 0.01 and ***P < 0.001.
Fig. 5.
Fig. 5.. Obstructed MPL-Cells induced long-time blockages in the cerebral blood vessels.
(A) Representative MPL-Cells, time points in which cells appear were marked on the graph, and time 0 represents the imaging start. (B to D) Imaging of MPL-Cells sectioned at different depths (B); z-stack imaging of the MPL-Cells (C); reconstruction of MPL-Cells 3D images, two sections, I and II, of cell correspond to the imaged sections in (B). (D). (E) The density of MPL-Cells within each two-photon imaging FOV was calculated and analyzed at different time points after treatment (n = 10 FOVs from four mice per time point). (F) Showing MPL-Cell distribution at larger FOV by image stitching, at 3 hours after MP injection. (G) Long-time imaging arrangements. Created using FigDraw.com. (H) An MPL-Cell that has been obstructed in a vessel for 7 days. (I) The density of MPL-Cells in the brain cortex at the indicated time points (n = 10 FOVs from four mice per time point). Data are represented as means ± SEM. *P < 0.05.
Fig. 6.
Fig. 6.. Cell obstruction is influenced by the size of the plastic particles.
(A) Exposure experiments were conducted on mice using plastic particles of varying sizes, and images of cells labeled with fluorescent plastics of different sizes were captured during the imaging of blood vessels. (B) The density of plastic-labeled cells (PL-Cells) within each FOV was calculated and analyzed. Data collected at 2 hours after treatment (n = 15 FOVs from four mice for the 5-μm group and n = 15 FOVs from two mice for the 5-μm and 0.08-μm groups). (C) PL-Cell densities at different time points after exposure were comparatively analyzed (n = 15 FOVs from four mice for the 5-μm group and n = 15 FOVs from two mice for the 5-μm and 0.08-μm groups). (D) A comparative analysis of PL-Cell density was performed following exposure to different concentrations of 5 μm MPs (n = 15 FOVs from four mice for group at 50 μg/ml and n = 15 FOVs from two mice for groups at 25 and 5 μg/ml). Data are represented as means ± SEM. *P < 0.05 and ***P < 0.001.
Fig. 7.
Fig. 7.. MPL-Cell obstructions as thrombus formation inhibit intracerebrovascular blood perfusion.
(A) Representative laser speckle contrast imaging (LSCI) images at indicated time points after treatment. A black line square identifies an ROI location with perfusion units (PU) > 500, and a white circle identifies an ROI location with PU < 400. (B) Quantitative statistical analysis of ROIs (n = 30). (C to E) Analysis of ROIs with PU > 500 (n = 8), ROIs with 400 < PU < 500 (n = 9), and ROIs with PU < 400 (n = 13). Three independent replicated experiments verified the results. Data are represented as means ± SEM. *P < 0.05, **P < 0.01, and ***P < 0.001.
Fig. 8.
Fig. 8.. Suppressed blood flow in the brain causes neurobehavioral disorders.
(A) Schematic representation of the arrangements for behavioral experiments. Created using FigDraw.com. (B to E) An open-field experiment was performed on MP-treated and control mice (n = 10 to 11 mice for each group), representative diagrams of mouse locomotor trajectories (B), analytical statistics of the total travel distance (C), movement speeds (D), and the number of trips to the center zone (E). (F to H) Y-maze experiment (n = 11 mice for each group), representative diagrams of mouse locomotor trajectories (F), analytical statistics of the total movements (G), and alternation triplet (H). (I) The latency time in the rotarod test of the MP-treated and control mice (n = 12 mice for each group). (J) Hanging time for MP-treated mice and control mice experimented on different days after MP treatment (n = 12 mice for each group). (K) Latency time in the rotarod test at 28 days after MP treatment (n = 12 mice for each group). (L) Body weight change curves of mice affected by MP treatment (n = 11 to 12 mice for each group). (M) Analytical statistics of the obstructed MPL-Cell density in the brain at 7 and 28 days after MP treatment (n = 20 FOVs from four mice per time point). Data are represented as means ± SEM. *P < 0.05, **P < 0.01, and ***P < 0.001.

Similar articles

Cited by

References

    1. Banerjee A., Shelver W. L., Micro- and nanoplastic induced cellular toxicity in mammals: A review. Sci. Total Environ. 755, 142518 (2021). - PubMed
    1. Huang W., Song B., Liang J., Niu Q., Zeng G., Shen M., Deng J., Luo Y., Wen X., Zhang Y., Microplastics and associated contaminants in the aquatic environment: A review on their ecotoxicological effects, trophic transfer, and potential impacts to human health. J. Hazard. Mater. 405, 124187 (2021). - PubMed
    1. Law K. L., Narayan R., Reducing environmental plastic pollution by designing polymer materials for managed end-of-life. Nat. Rev. Mater. 7, 104–116 (2022).
    1. Jambeck J. R., Geyer R., Wilcox C., Siegler T. R., Perryman M., Andrady A., Narayan R., Law K. L., Plastic waste inputs from land into the ocean. Science 347, 768–771 (2015). - PubMed
    1. Lebreton L. C. M., van der Zwet J., Damsteeg J.-W., Slat B., Andrady A., Reisser J., River plastic emissions to the world’s oceans. Nat. Commun. 8, 15611 (2017). - PMC - PubMed

LinkOut - more resources