. 2025 Jan 24;11(4):eadu5787.
doi: 10.1126/sciadv.adu5787. Epub 2025 Jan 22.

Global cellular proteo-lipidomic profiling of diverse lysosomal storage disease mutants using nMOST

Affiliations

Global cellular proteo-lipidomic profiling of diverse lysosomal storage disease mutants using nMOST

Felix Kraus et al. Sci Adv. .

Abstract

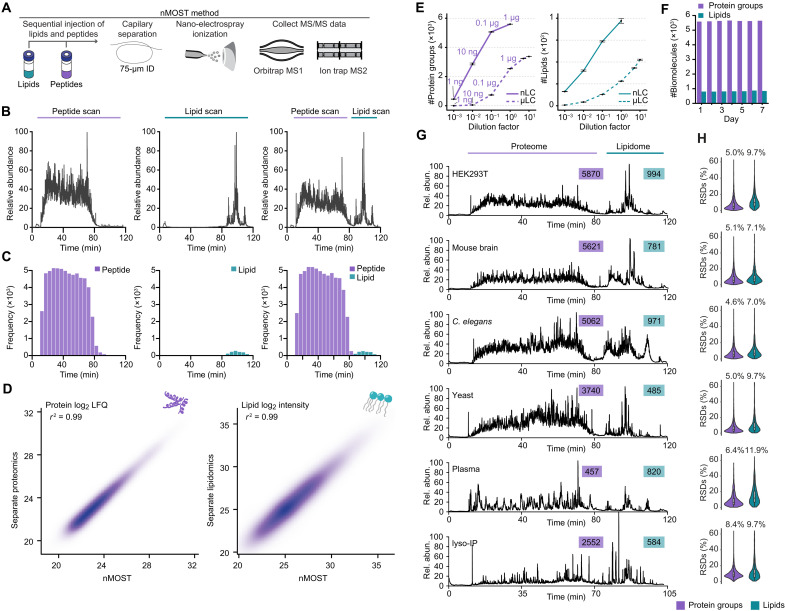
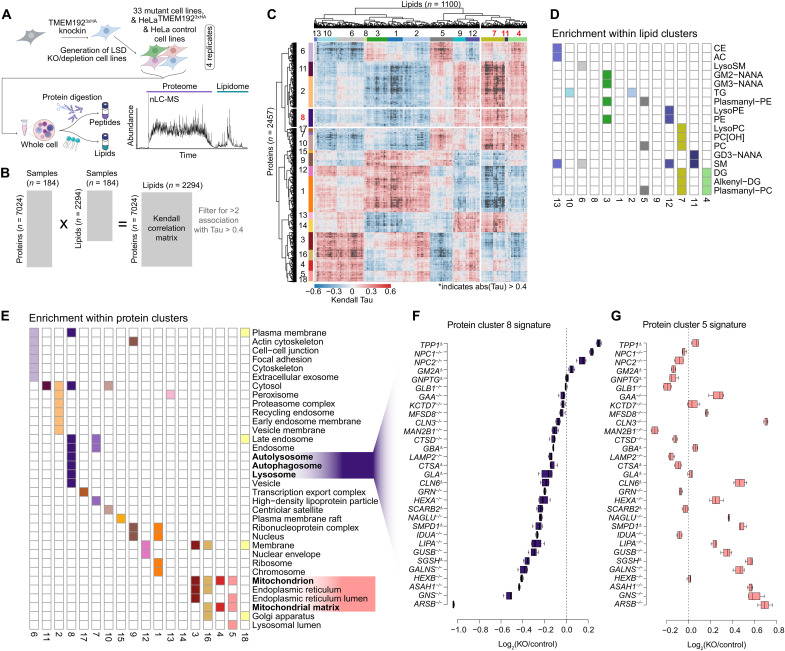
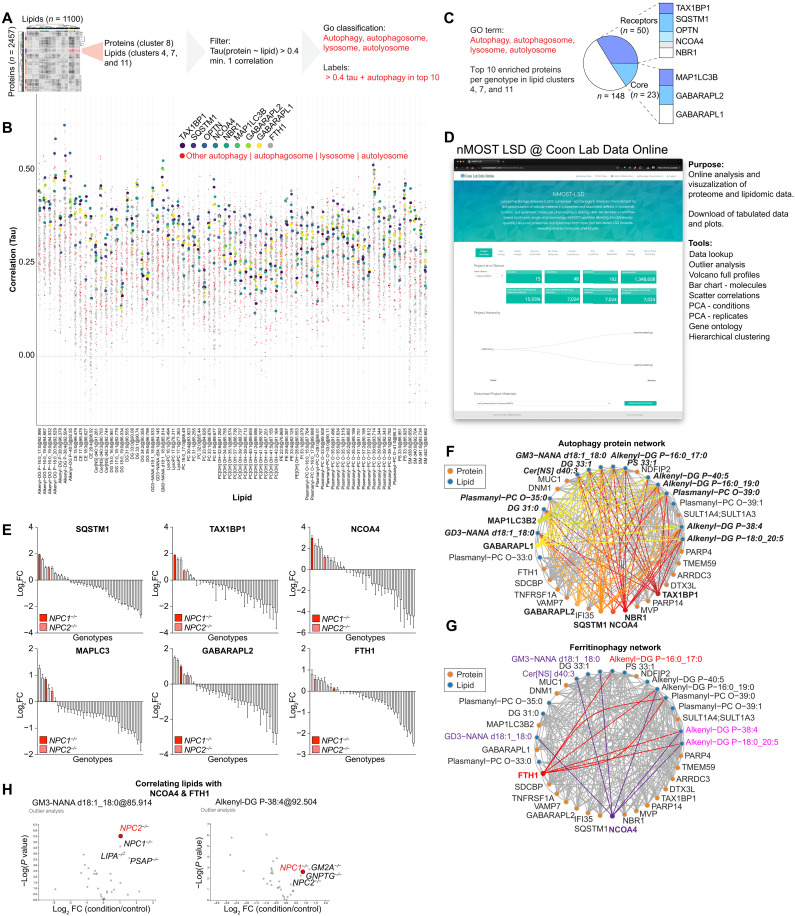
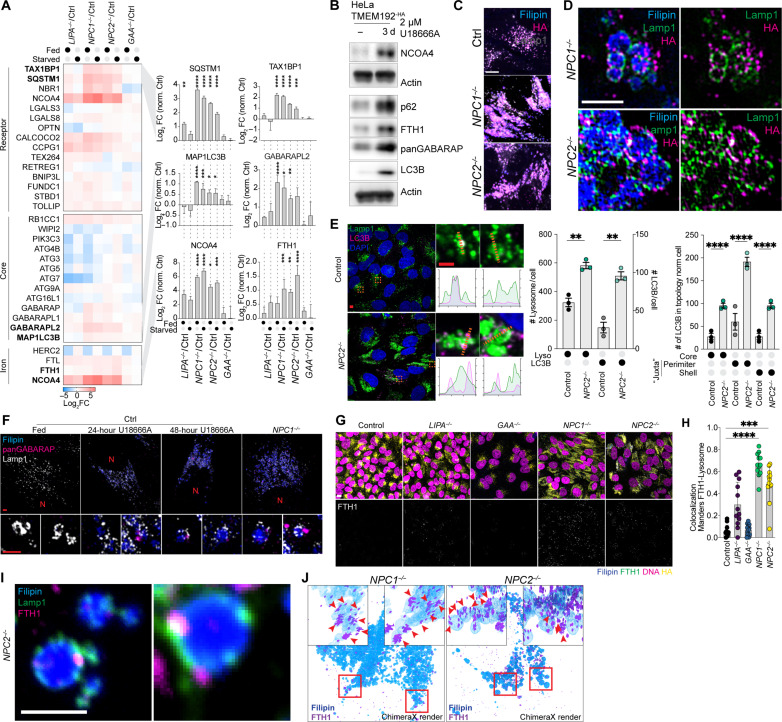
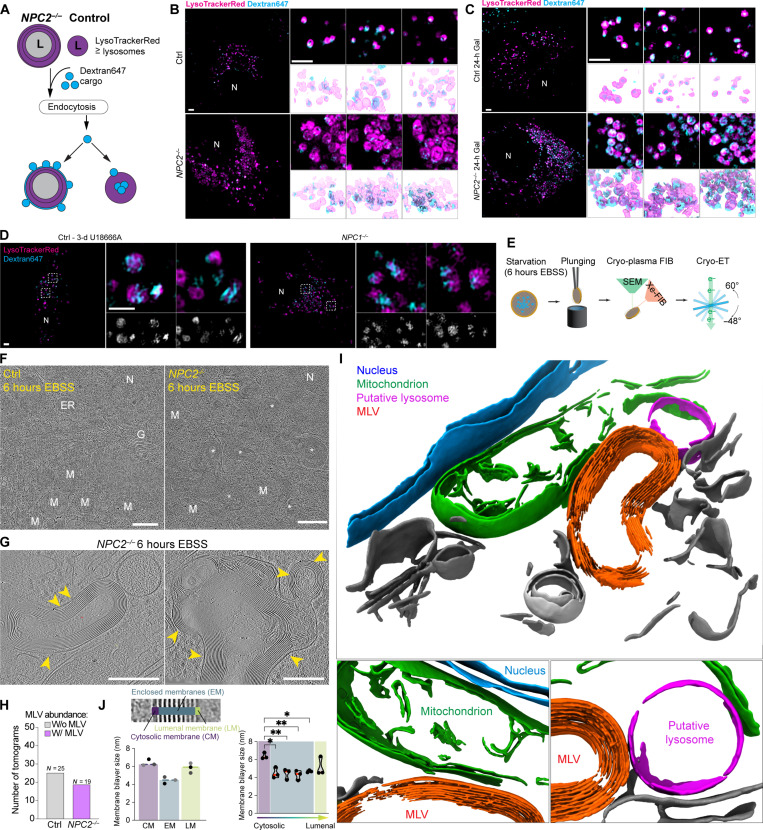
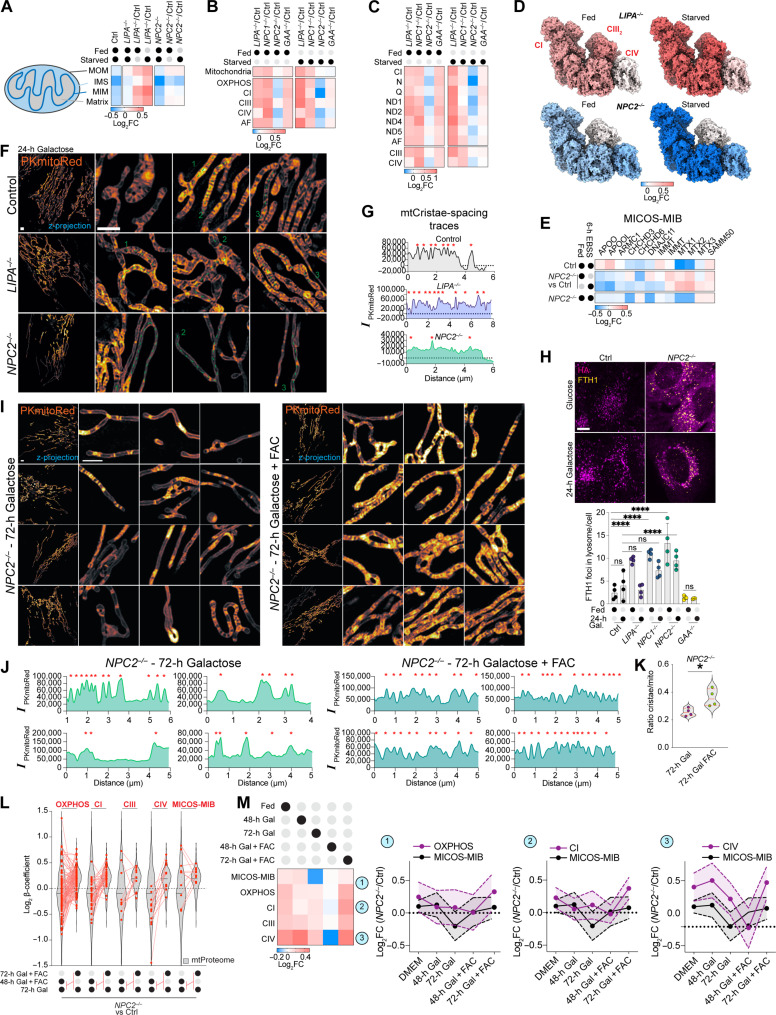
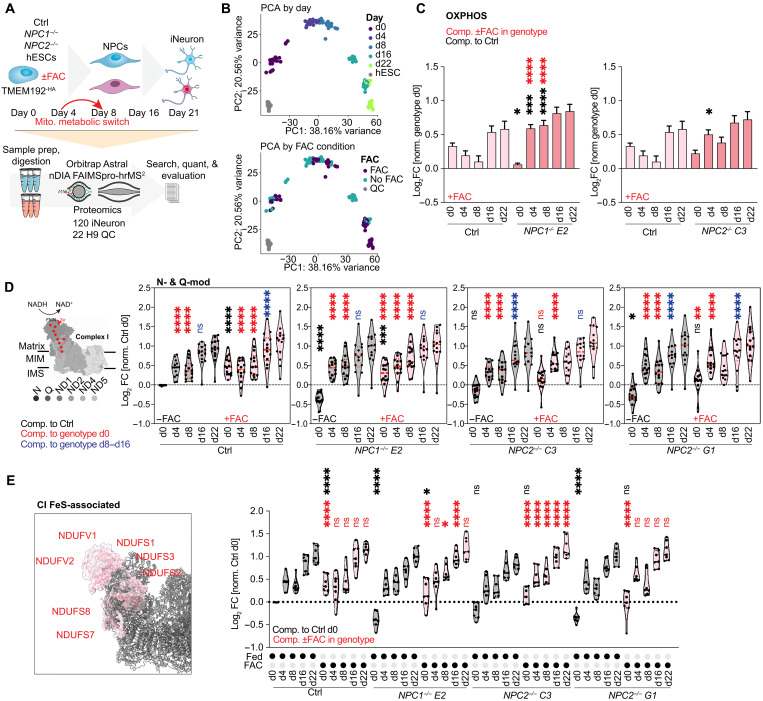
Lysosomal storage diseases (LSDs) comprise ~50 monogenic disorders marked by the buildup of cellular material in lysosomes, yet systematic global molecular phenotyping of proteins and lipids is lacking. We present a nanoflow-based multiomic single-shot technology (nMOST) workflow that quantifies HeLa cell proteomes and lipidomes from over two dozen LSD mutants. Global cross-correlation analysis between lipids and proteins identified autophagy defects, notably the accumulation of ferritinophagy substrates and receptors, especially in NPC1-/- and NPC2-/- mutants, where lysosomes accumulate cholesterol. Autophagic and endocytic cargo delivery failures correlated with elevated lysophosphatidylcholine species and multilamellar structures visualized by cryo-electron tomography. Loss of mitochondrial cristae, MICOS complex components, and OXPHOS components rich in iron-sulfur cluster proteins in NPC2-/- cells was largely alleviated when iron was provided through the transferrin system. This study reveals how lysosomal dysfunction affects mitochondrial homeostasis and underscores nMOST as a valuable discovery tool for identifying molecular phenotypes across LSDs.


Figures

Fig. 1.
Fig. 1.. Development and benchmarking of nMOST for proteomic and lipidomic analysis.
(A) Schematic of the nMOST method, which allows proteome and lipidome analysis by LC-MS. Lipid and protein extracts isolated from the same cell sources are sequentially injected onto LC before elution with an organic gradient and MS analysis (see Methods). (B) Chromatograms showing HEK293 cell peptide and lipid elution features during a 120-min gradient examining (left) total protein extract, (middle) total lipid extract, and (right) sequentially loaded protein and lipid extracts and nMOST analysis. The vast majority of peptides elute before 80 min, while the majority of lipids elute between 80 and 120 min. (C) Peptide and lipid identifications from the corresponding LC-MS run in (B). (D) Correlation of proteins (left) and lipids (right) identified by separate LC-MS (y axis) versus nMOST (x axis). r2 values are > 0.99. (E) Number of protein groups and lipid groups identified by nMOST versus μMOST methods. nMOST routinely outperformed μMOST for both proteins (left) and lipids (right). Amount of peptide injections are labeled above the line for each nMOST and μMOST. (F) Performance was comparable for both proteins and lipids when measured daily over a 7-day acquisition period. (G) nMOST allows simultaneous analysis of proteins and lipids from HEK293 cells, mouse brain extracts, C. elegans extracts, budding yeast extracts, human plasma, and lysosomes from HeLa cells isolated by lyso-IP. (H) RSD values for the data in (G).
Fig. 2.
Fig. 2.. Landscape of total proteomes and lipidomes from LSD mutant cells using nMOST.
(A) Schematic describing the method for analysis of total cell extracts across 33 LSD mutants. Protein and lipid extracts were isolated from the samples in quadruplicate and then sequentially injected for analysis by LC-MS over a 120-min gradient. (B) Schematic depicting the method used for lipid/protein cross-correlation analysis using a Kendall rank correlation (filtered for >1 association with Tau > 0.4). (C) Heatmap for Tau values. Clusters for proteins and lipids are shown. (D) Schematic showing the enrichment of specific lipids within individual lipid clusters. (E) Schematic showing the subset of GO term cellular compartment enriched within individual protein clusters. (F) Summed protein cluster 8 signature [sum abundance of all proteins within cluster 8 (enriched for autophagy terms)] across the LSD mutant cells plotted as log2FC [KO/wild type (WT)]. (G) Signature of protein cluster 5 (sum protein abundance relative to WT) across the LSD mutant cells.
Fig. 3.
Fig. 3.. An nMOST-LSD resource for lipid-protein correlation analysis.
(A) Schematic of search strategy to find functional protein-lipid relationships from LSD-nMOST cross-ome dataset. (B) Manhattan-style plot of lipid species (x axis, lipid clusters 4, 7, and 11) versus protein correlations from protein cluster 8. Red dots represent proteins associated with GO terms autophagy, autophagosome, lysosome, and autolysosome. In addition, select autophagy proteins are highlighted in viridis color scheme. (C) Pie chart of top 10 enriched proteins from (B). Autophagy receptors and autophagy core components represent ~50 of the hits, and composition is shown on the right. (D) Screenshot of nMOST LSD on the Coon Lab Data Online portal. Tools available online are listed on the right. (E) Log2FC ranked bar graph of indicated autophagy proteins across all analyzed LSD genotypes. NPC1−/− and NPC2−/− genotypes are highlighted in shades of red. Data extracted from online portal. (F and G) Protein-lipid network extracted from protein cluster 8 and lipid clusters 4, 7, and 11. (F) Protein-lipid connections for autophagy markers. (G) Protein-lipid connections for ferritinophagy markers. (H) Outlier analysis of two lipid species highlight correlated with NCOA4 and FTH1 [see (G)]. Data were extracted from online portal.
Fig. 4.
Fig. 4.. Juxta-lysosomal autophagy receptors and ferritin accumulation in NPC1−/− and NPC2−/− cells.
(A) Log2FC relative to control cells for the indicated autophagy receptors for 4KO cells. MAPLC3B: ****P < 0.0001, ***P = 0.0001, and *P = 0.0129 and 0.0157. SQSTM1: ****P < 0.0001 and **P = 0.0047. TAX1BP1: ****P < 0.0001 and ***P = 0.0001. NCOA4: ****P < 0.0001, ***P = 0.0001, and *P = 0.0244; FTH1: ****P < 0.0001, ***P = 0.0007, and **P = 0.0075. Quadruplicate nMOST measurements, ordinary one-way analysis of variance (ANOVA) with multiple comparisons, α = 0.05. Error bars, SD. (B) Immunoblotting of lysates from HeLa control cells treated for 3 days ±U18666A. (C) Cells were stained with Filipin and immunostained with α-LAMP1 and α-HA to detect TMEM192-HA in lysosomes, followed by confocal microscopy. Scale bar, 10 μm. (D) Cells from (C) examined with 3D-SIM. Scale bar, 2 μm. (E) Immunostaining of indicated cells with α-LAMP1, α-LC3B; nuclei stained with 4′,6-diamidino-2-phenylindole (DAPI). LC3B intensities across individual Lamp1-positive lysosomes. Scale bars, 5 and 2 μm (insets). Right: LC3/LAMP1 quantification. (F) 3D-SIM reconstructions of HeLa control cells treated for the indicated times with U18666A and NPC1−/− immunostained for α-LAMP1 and α-panGABARAP. N, position of nucleus. (G) Confocal images of control and 4KO cells (fed) immunostained with α-FTH1 and α-HA to detect TMEM192HA. Cholesterol-rich lysosomes were stained with Filipin, and nuclei were stained with DNA SPY555. Scale bar, 20 μm. (H) Images from (G) were quantified by measuring Mander’s overlap between FTH1 signal and lysosome mask provided by α-HA staining. Data from 12 image stacks per condition; genotype (# cells, fed): Control(3307), LIPA−/− (1996), GAA−/− (1401), NPC1−/− (1211), and NPC2−/− (1629). Error bars, SD. (I) Confocal images of NPC2−/− cells immunostained for α-LAMP1 and α-FTH1, with Filipin-marked lysosomes. A single z-slice is shown. Scale bar, 2 μm. (J) 3D-SIM reconstructions of NPC1−/− or NPC2−/− cells immunostained with α-FTH1 and surface volume of cholesterol-rich lysosomes marked by Filipin.
Fig. 5.
Fig. 5.. Multilamellar membranes in NPC2−/− lysosomes visualized by cryo-ET.
(A) Schematic showing dextran endocytosis and lysosomal incorporation in control and NPC2−/− cells. In control cells, endocytosis successfully delivers dextran to the lysosomal lumen via vesicle fusion. Fusion-dependent delivery of dextran is reduced NPC2−/− cells, with successful fusion events resulting in dextran present between the limiting lysosomal membrane and the first internal membrane. (B) Indicated cells were treated with dextran conjugated with Alexa647 dye and imaged by live-cell 3D-SIM. 3D-SIM reconstructions are shown below. Scale bars, 2 μm. (C) As in (B), but with galactose (Gal) growth media [24 hours (h)]. Scale bars, 2 μm. (D) Control cells were treated with the NPC1 inhibitor U18666A (3 days) alongside NPC1−/− cells with dextran conjugated with Alexa647 dye and imaged by live-cell 3D-SIM. 3D-SIM reconstructions are shown below. Scale bars, 2 μm. (E) Cryo-ET workflow. (F) Lamella overviews of control and NPC2−/− cells with 6 hours of EBSS treatment. Scale bars, 500 nm. (G) Tomogram slice of multilamellar vesicles (MLVs) in NPC2−/− cells. Scale bars, 200 nm. (H) Quantification of MLV-containing tomograms from control and NPC2−/− cells. Number of tomograms analyzed is indicated. (I) 3D renderings of a segmented NPC2−/− tomogram. Zoom-ins highlighting close proximity between MLV (orange) with mitochondria (green), with a putative lysosome (pink) below. (J) Quantification of membrane bilayer size (left) and distance between membrane leaflets (right) across three tomograms for the cytosolic membrane (CM), the enclosed membranes (EM), and the luminal membrane (LM). Quantification of spacing between individual membranes: CM to first EM (left), between EMs (middle), and EM to LM (right). *P = 0.011 and 0.21 and **P = 0.0086 and 0.0052. Data based on triplicate lamellae, ordinary one-way ANOVA with multiple comparisons, α = 0.05. Error bars, SD. ER, endoplasmic reticulum; G, Golgi; M, mitochondria; N, Nucleus.
Fig. 6.
Fig. 6.. Mitochondrial cristae/OXPHOS system defects in NPC2−/− cells and amelioration by extracellular iron.
(A) Mitochondrial compartment heatmap (log2FC) in fed or EBSS-treated control and 4KO cells (n = 4). (B) Log2FC values for OXPHOS modules for 4KO cells in fed or EBSS-treated cells (n = 4). (C) Log2FC of replisome submodule abundance [quadruplicate fed versus EBSS treated control or 4KO cells (nMOST data)]. (D) Abundance from (B) mapped onto CI, CIII2, and CIV structure [Protein Data Bank (PDB): 5XTH]. Color panel, log2FC values. (E) MICOS-MIB complex heatmap for 4KO cells (normalized with control). Biological quadruplicate nMOST measurements. (F) Z-projections of live-cell 3D-SIM images from control, LIPA−/−, and NPC2−/− cells (galactose, 24 hours) stained with IMS dye PKmitoRed. Scale bar, 2 μm. (G) Line plots of dashed lines from (F). (H) Control and NPC2−/− cells grown in glucose (fed) or galactose (24 hours) followed by immunostaining with α-HA to detect TMEM192HA and α-FTH1 to detect Ferritin. Scale bar, 10 μm. Right: Quantification of FTH1 signal overlapping with lysosome staining/cell. Data from biological quadruplicates per sample (each replicate containing five to nine stacks); ****P < 0.0001, ordinary two-way ANOVA, multiple comparisons, α = 0.05. Error bars, SD. (I) Z-projections of live-cell 3D-SIM images from control and NPC2−/− cells after galactose (72 hours) ± FAC and stained with the IMS dye PKmitoRed. Scale bars, 2 μm. (J) Line plots of individual mitochondria from (I). Red asterisks, positions of cristae. (K) Violin plot depicting the ratio of cristae to mitochondria ± FAC. Data based on 132 (72-hour galactose) or 148 (72-hour galactose + FAC) segmented planes of ROI stacks from data in (I); *P = 0.0242, unpaired t test. (L) Log2 β-coefficient for OXPHOS subunits and individual subcomplexes. (M) Log2FC (NPC2−/−/control) for indicated protein complexes under the indicated conditions (time in galactose ± FAC addback) (n = 3). ns, not significant.
Fig. 7.
Fig. 7.. Proteomic analysis of NPC mutants during neurogenesis with iron addback.
(A) Proteomic analysis of NGN2-driven neurogenesis ± iron (n = 3 per time point). (B) PCA of LFQ data, color coding, day of differentiation, or ±FAC. (C) Mean log2FC (normalized within genotype day 0) mitochondrial OXPHOS components with FAC. Black asterisks, comparison to control cells; red asterisks, comparison ± FAC within genotype. N = 3; NPC1−/− clone E2 d0: *P = 0.0286; d4: ***P = 0.0003; d8, d4 + FAC, and d8 + FAC: ****P < 0.0001. NPC2−/− clone C3 d0: *P = 0.0420. Ordinary two-way ANOVA, multiple comparisons, α = 0.05. Error bars, SEM. (D) Violin plots of log2FC (normalized to day 0 control) N- and Q-module of CI. Left: CI and FeS clusters (based on PDB: 5XTH). Abundance comparisons during time course ± FAC treatment are shown for each genotype (gray, −FAC; red, +FAC). Black asterisks, comparison to control cells; red asterisks, comparison within genotype. Blue asterisks, comparison of days 8 to 16 within genotype. N = 3; control d0, d4, and d8: ****P < 0.0001; d4 and d8 + FAC: ****P < 0.0001; d8 to d16: ****P < 0.0001. NPC1−/− clone E2 d0: ****P < 0.0001; d0 + FAC: ***P = 0.0002; all other: ****P < 0.0001. NPC2−/− clone C3: ****P < 0.0001. NPC2−/− G1 d0: *P = 0.0396; d0 + FAC: **P = 0.0041; all other: ****P < 0.0001. Ordinary two-way ANOVA, multiple comparisons, α = 0.05. Error bars, SEM. (E) FeS-associated CI N- and Q-modules (red) overlayed with rest of the complex in gray (PDB: 5XTH). Violin plots of log2FC (normalized to control, day 0) FeS-associated proteins. Abundance during differentiation time course ± FAC treatment (gray for −FAC, red for +FAC). Black asterisks, statistical comparison to control cells; red asterisks, comparison within genotype ± FAC. N = 3; control: ****P < 0.0001. NPC1−/− clone E2 d0: *P = 0.0489; d8 + FAC: *P = 0.0146; all other: ****P < 0.0001. NPC2−/− clone C3: ****P < 0.0001. NPC2−/− G1: ****P < 0.0001. Ordinary two-way ANOVA, multiple comparisons, α = 0.05. Error bars, SEM.

Update of

Similar articles

References

    1. Lawrence R. E., Zoncu R., The lysosome as a cellular centre for signalling, metabolism and quality control. Nat. Cell Biol. 21, 133–142 (2019). - PubMed
    1. Mutvei A. P., Nagiec M. J., Blenis J., Balancing lysosome abundance in health and disease. Nat. Cell Biol. 25, 1254–1264 (2023). - PubMed
    1. Platt F. M., d'Azzo A., Davidson B. L., Neufeld E. F., Tifft C. J., Lysosomal storage diseases. Nat. Rev. Dis. Primers. 4, 27 (2018). - PubMed
    1. Robak L. A., Jansen I. E., van Rooij J., Uitterlinden A. G., Kraaij R., Jankovic J., International Parkinson’s Disease Genomics Consortium (IPDGC), Heutink P., Shulman J. M., Excessive burden of lysosomal storage disorder gene variants in Parkinson's disease. Brain 140, 3191–3203 (2017). - PMC - PubMed
    1. Alcalay R. N., Mallett V., Vanderperre B., Tavassoly O., Dauvilliers Y., Wu R. Y. J., Ruskey J. A., Leblond C. S., Ambalavanan A., Laurent S. B., Spiegelman D., Dionne-Laporte A., Liong C., Levy O. A., Fahn S., Waters C., Kuo S. H., Chung W. K., Ford B., Marder K. S., Kang U. J., Hassin-Baer S., Greenbaum L., Trempe J. F., Wolf P., Oliva P., Zhang X. K., Clark L. N., Langlois M., Dion P. A., Fon E. A., Dupre N., Rouleau G. A., Gan-Or Z., SMPD1 mutations, activity, and α-synuclein accumulation in Parkinson's disease. Mov. Disord. 34, 526–535 (2019). - PMC - PubMed

LinkOut - more resources