. 2025 Jan 24;11(4):eadq3874.
doi: 10.1126/sciadv.adq3874. Epub 2025 Jan 22.

Rescue-like behavior in a bystander mouse toward anesthetized conspecifics promotes arousal via a tongue-brain connection

Affiliations

Rescue-like behavior in a bystander mouse toward anesthetized conspecifics promotes arousal via a tongue-brain connection

Peng Cao et al. Sci Adv. .

Abstract

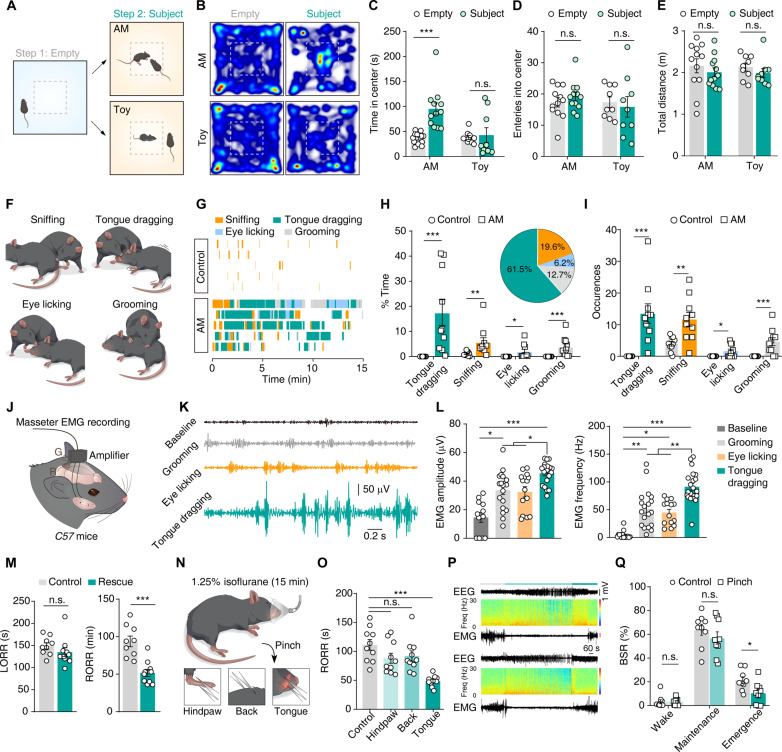
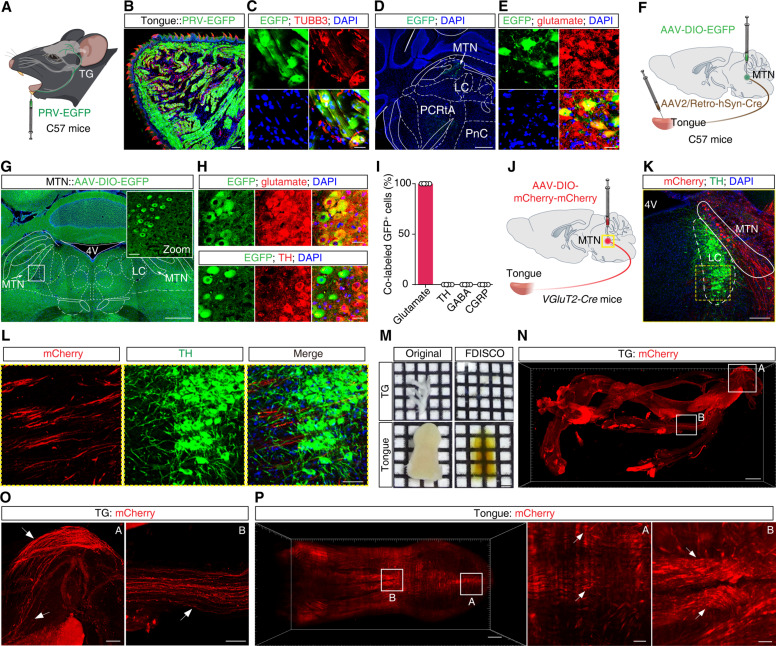
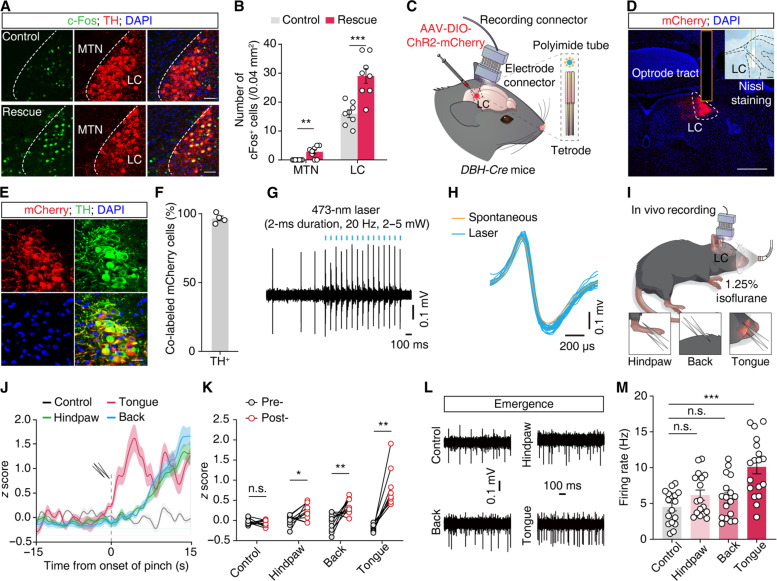
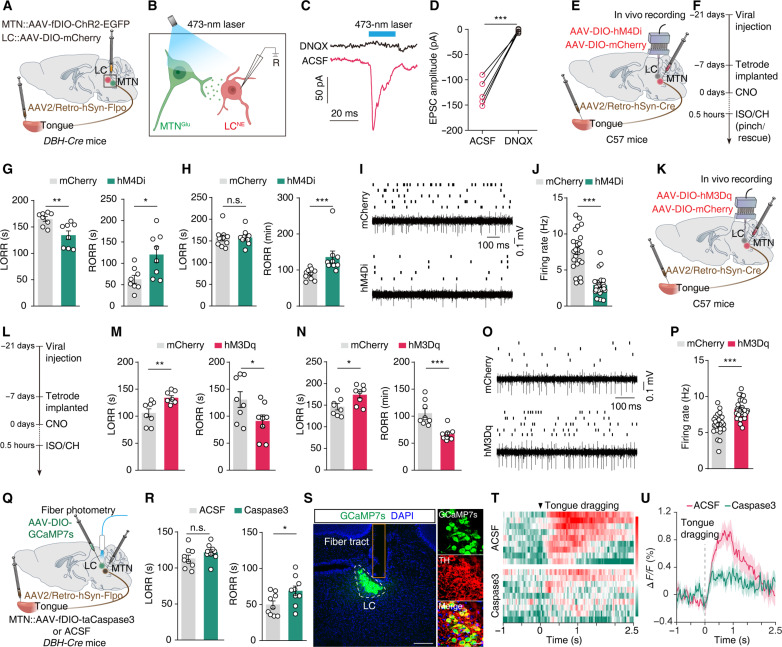
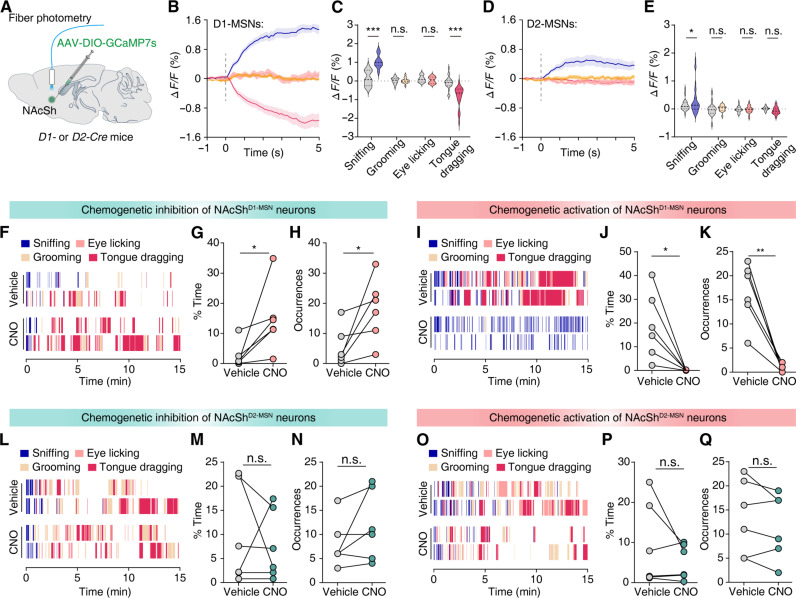
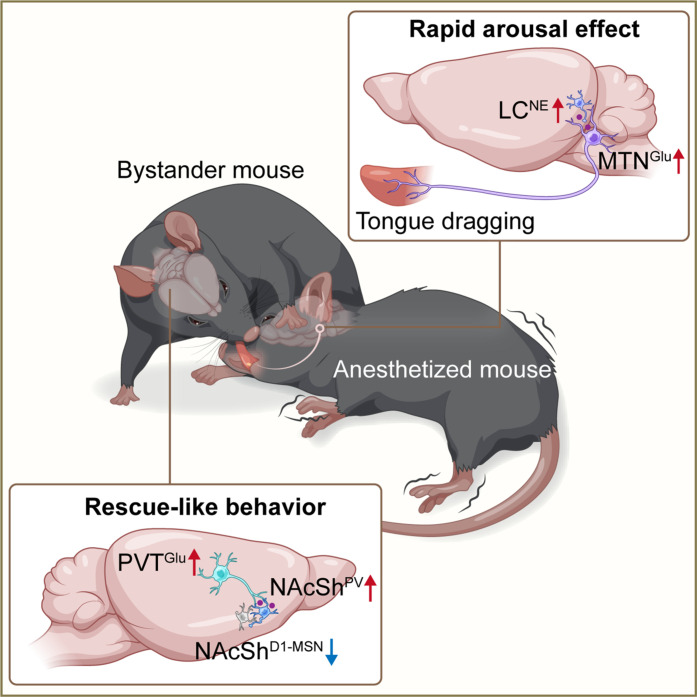
Prosocial behaviors are advantageous to social species, but the neural mechanism(s) through which others receive benefit remain unknown. Here, we found that bystander mice display rescue-like behavior (tongue dragging) toward anesthetized cagemates and found that this tongue dragging promotes arousal from anesthesia through a direct tongue-brain circuit. We found that a direct circuit from the tongue → glutamatergic neurons in the mesencephalic trigeminal nucleus (MTNGlu) → noradrenergic neurons in the locus coeruleus (LCNE) drives rapid arousal in the anesthetized mice that receive the rescue-like behavior from bystanders. Artificial inhibition of this circuit abolishes the rapid arousal effect induced by the rescue-like behavior. Further, we revealed that glutamatergic neurons in the paraventricular nucleus of the thalamus (PVTGlu) that project to the nucleus accumbens shell (NAcSh) mediate the rescue-like behavior. These findings reveal a tongue-brain connection underlying the rapid arousal effects induced by rescue-like behavior and the circuit basis governing this specific form of prosocial behavior.


Figures

Fig. 1.
Fig. 1.. Bystander mice exhibit targeted rescue-like behavior that promotes arousal in anesthetized mice.
(A) Experimental paradigm for bystander mouse interacts with anesthetized mouse (AM). (B to E) Representative heatmaps (B) and summary data [(C) to (E)] of bystander mice paired with AM or toy mice in the open field test. n (AM) = 12, n (toy) = 9. (F and G) Schematic diagram (F) and example raster (G) showing the various behaviors observed in bystander mice with AM or saline-treated controls. (H and I) Total duration percentage (H) and occurrences (I) for various behaviors of bystander mice toward saline-treated controls or AM. Pie charts indicate the proportion of behavioral occurrence in (H). n = 10. (J and K) Schematic diagram (J) and example EMG traces (K) showing EMG recording from masseter muscles of bystander mice. (L) Quantitation of EMG amplitude and frequency. n (baseline, grooming, eye licking, and tongue dragging) = 12, 19, 14, and 21 trails from five mice, respectively. (M) Time of anesthetic induction (LORR, loss of righting reflex) and recovery (RORR, recovery of righting reflex) after intraperitoneal injection of chloral hydrate in AM in the presence (rescue) or absence (control) of bystander mice. n (control) = 9, n (rescue) = 10. (N) Schematic for the application of pinch stimuli to the hindpaw, back, or tongue of isoflurane-AM. (O) Summary data for the RORR from the isoflurane-AM. n = 10. (P) Examples of EEG and EMG data from isoflurane-AM treated with (pinch) or without tongue pinching (control) during the emergence period. Continuous EEG spectrograms are plotted underneath the raw EEG traces. (Q) Summary data for the BSR in the wake, maintenance, and emergence periods. n = 9. Data are presented as the means ± SEMs. *P < 0.05, **P < 0.01, and ***P < 0.001; n.s., not significant. Details of the statistical analyses are presented in table S1.
Fig. 2.
Fig. 2.. MTNGlu neurons directly project to the tongue.
(A) Schematic for retrograde transsynaptic tracing from the tongue to the MTN using PRV-EGFP. (B and C) Representative images of the tongue injection site of PRV-EGFP (B). The inset depicts the area shown in the white box, in which EGFP+ cells colocalized with an antibody against TUBB3 (C). Scale bars, 100 μm (overview) and 20 μm (inset). (D and E) Representative images showing EGFP+ neurons in the MTN (D); these signals were colocalized with a glutamate-specific antibody (E). Scale bars, 500 μm (overview) and 20 μm (inset). (F) Schematic for anterograde monosynaptic tracing from the tongue to the MTN. (G) Representative images showing viral expression in the MTN. Scale bars, 500 μm (overview) and 50 μm (inset). (H and I) Representative images (H) and quantification analysis (I) showing the EGFP-labeled tongue-projecting MTN neurons colocalized with a glutamate-specific antibody but not with a TH antibody. Scale bars, 20 μm. n = 4 mice. (J) Schematic diagram of AAV-DIO-mCherry-mCherry virus injection in the MTN of VGluT2-Cre mice. (K and L) Representative images of the injection site and viral expression within the MTN of VGluT2-Cre mice. Scale bars, 200 μm (overview) and 50 μm (zoom). (M) Representative images of intact, unsectioned tissue of trigeminal ganglion (TG) and tongue tissue before (original) and after (FDISCO) inducing translucency. Scale bar, 2.3 mm. (N to P) Representative images of whole TG (N and O) and tongue (P) sections showing the mCherry signal with AAV-DIO-mCherry-mCherry virus injection in the MTN. Scale bars, 500 μm. The zoom images are magnified views from the white-boxed regions in the TG and tongue. Scale bars, 100 μm. Data are presented as the means ± SEMs.
Fig. 3.
Fig. 3.. The rescue-like behavior increases LCNE neuronal activity.
(A and B) Representative images (A) and quantification (B) of c-Fos+ neurons in the MTN and the LC of AM in the presence (rescue) or absence (control) of bystander mice. Scale bars, 50 μm. n = 8 slices from four mice. (C) Schematic diagram of in vivo electrophysiological recording with an optrode. (D) Representative images of the virus injection site and Nissl staining of the optrode tract in the LC. Scale bars, 500 μm (overview) and 100 μm (zoom). (E and F) Representative images (E) and quantitative data (F) showing that mCherry+ neurons were colocalized with a TH-specific antibody in the LC. Scale bar, 20 μm. (G and H) Example recording of spontaneous and light-evoked spikes from LCNE neurons (G) and overlay of averaged spontaneous (yellow) and light-evoked (blue) spike waveforms from the example unit (H). (I) Schematic for in vivo electrophysiological recording in isoflurane-AM with or without (control) the application of pinch stimuli to the tongue, hindpaw, and back skin during the emergence period, respectively. (J and K) Representative traces (J) and responses (K) of LCNE neurons from control, pinched hindpaw, back, and tongue of AM during the emergence period. The dashed line indicates the onset of pinching stimuli. The bold line and light shadow indicate the mean and SEM, respectively. n (control, hindpaw, back, and tongue) = 9, 10, 10, and 8 units from 4 mice, respectively. (L and M) Raster plots with typical traces (L) and quantitative data (M) of spontaneous firing rates of LCNE neurons in AM. n (control, hindpaw, back, and tongue) = 17, 17, 17, and 18 units from four mice, respectively. Data are presented as the mean ± SEMs. *P < 0.05, **P < 0.01, and ***P < 0.001. Details of the statistical analyses are presented in table S1. DAPI, 4′,6-diamidino-2-phenylindole.
Fig. 4.
Fig. 4.. The tongue-projecting MTNGlu controls arousal.
(A and B) Schematic for optogenetics and whole-cell patch-clamp recordings. (C and D) Representative traces and summary data for light-evoked postsynaptic currents recorded from LCNE neurons. n = 5. (E and F) Schematic and timeline of chemogenetic inhibition and recording in vivo. (G) Summary data for LORR and RORR from isoflurane-anesthetized mCherry and hM4Di mice after tongue pinching during the emergence period. n = 8. (H) Summary data for LORR and RORR from chloral hydrate-anesthetized mCherry and hM4Di mice after received rescue-like behavior from bystander mice. n (mCherry) = 10, n (hM4Di) = 9. (I and J) Raster plots with typical traces and quantitative data of spontaneous firing rates of LCNE neurons from indicated group. n (mCherry and hM4Di) = 24 and 23 units from four mice, respectively. (K and L) Schematic and timeline of chemogenetic activation and recording in vivo. (M to P) As indicated in (G) to (J), but for mCherry and hM3Dq mice. n = 8 for (M) and (N), while n (mCherry and hM3Dq) = 24 and 25 units from 4 mice for (P), respectively. (Q) Schematic of virus injection and fiber photometry recordings in vivo in DBH-Cre mice. (R) Summary data for LORR and RORR from isoflurane-anesthetized ACSF and taCaspase3 mice after tongue pinching during the emergence period. n = 9. (S) Representative images validate GCaMP7s expression in TH+ neurons. Scale bars, 200 μm (overview) and 20 μm (inset). (T) Heatmaps across animals aligned to the time from onset of bystander mice engage in tongue dragging toward AM. (U) Average ΔF/F of LC-NEGCaMP7s signals from indicated group. Data are presented as the means ± SEMs. *P < 0.05, **P < 0.01, and ***P < 0.001. Details of the statistical analyses are presented in table S1.
Fig. 5.
Fig. 5.. NAcShPV neurons regulate the latency of rescue-like behavior in bystander mice.
(A and B) Schematic of fiber photometry and representative traces with summary ΔF/F signals from NAcSh-projecting PVTGlu neurons when bystander mice engaged in various behavior. Heatmaps across trials aligned to the time from onset of various behavior (bottom). n (sniffing, grooming, eye licking, and tongue dragging) = 18, 21, 22, and 33 trails from five mice, respectively. (C to E) As indicated in panels A and B, but for PVT-innervated NAcSh neurons. n = 26, 26, 24, and 32 trails from five mice, respectively. (F and G) Schematic for microendoscopic imaging and automatically extracted single neurons from imaging view in the NAcSh. (H) Pie chart showing the proportion of NAcShGCaMP7s neurons responding to various behaviors. (I to K) Example spontaneous ΔF/F time-series traces and summary data for calcium transients and average ΔF/F responses of NAcShGCaMP7s neurons. The black and gray dashed lines indicate the mean and SEM, respectively. n (sniffing, grooming, eye licking, and tongue dragging) = 62, 84, 46, and 33 cells from three mice, respectively. (L to N) Typical images and summary data for the PVT-innervated NAcShmCherry neurons were stained with a PV- or somatostatin (SST)–specific antibody. Scale bars, 100 μm (overview) and 20 μm (inset). (O) Schematic for optogenetics and whole-cell patch-clamp recordings. (P and Q) Representative traces and summary data for light-evoked postsynaptic currents recorded from NAcShPV neurons. n = 6. (R to W) Example raster plots and summary data for hM4Di- or hM3Dq-expressing bystander mice engaged in various behavior after treatment with vehicle or CNO. n = 6 for panels S and T; n = 8 for (V) and (W). Data are presented as the means ± SEMs. *P < 0.05, **P < 0.01, and ***P < 0.001. Details of the statistical analyses are presented in table S1.
Fig. 6.
Fig. 6.. NAcShD1-MSN but not NAcShD2-MSN neurons regulate tongue-dragging behaviors in bystander mice.
(A) Schematic of fiber photometry recording. (B and C) Representative traces and average ΔF/F signals of NAcShD1-MSN neurons when bystander mice engaged in various behavior. The bold line and light shadow indicate the means and SEM, respectively. n (sniffing, grooming, eye licking, and tongue dragging) = 18, 18, 8, and 23 trails from five mice, respectively. (D and E) As indicated in (B) and (C), but for NAcShD2-MSN neurons. n (sniffing, grooming, eye licking, and tongue dragging) = 32, 18, 23, and 32 trails from five mice, respectively. (F) Example raster plots showing bystander mice engaged in various behaviors after chemogenetic inhibition of NAcShD1-MSN neurons. (G and H) Total duration percentage (G) and the number of occurrences (H) of tongue-dragging behavior in hM4Di-expressing bystander mice after treatment with vehicle or CNO. n = 6 mice. (I to K) As indicated in (F) to (H), example raster plots and summary data from bystander mice following chemogenetic activation of NAcShD1-MSN neurons. n = 6 mice. (L to Q) As indicated in (F) to (K), but for chemogenetic inhibition or activation of NAcShD2-MSN neurons. n = 6 mice. Data are presented as the means ± SEMs. *P < 0.05, **P < 0.01, and ***P < 0.001. Details of the statistical analyses are presented in table S1.
Fig. 7.
Fig. 7.. Rescue-like behavior promotes arousal via a tongue-brain circuit.
The bystander mice engage in a form of rescue-like behavior (tongue dragging) toward other anesthetized mice, which aids the recipient’s arousal from general anesthesia. We found that a PVTGlu → NAcShPV → D1-MSN circuit initiates the rescue-like behavior of bystander mice, while a direct neural circuit of tongue → MTNGlu → LCNE mediates the rapid arousal effect induced by the rescue-like behavior in anesthetized mice. PVT, paraventricular nucleus of the thalamus; NAcSh, nucleus accumbens shell; MTN, mesencephalic trigeminal nucleus; LC, locus coeruleus; Glu, glutamate; PV, parvalbumin; NE, norepinephrine; D1-MSN, dopamine-1 receptor–expressing medium spiny neuron.

Similar articles

Cited by

References

    1. de Waal F. B. M., Preston S. D., Mammalian empathy: Behavioural manifestations and neural basis. Nat. Rev. Neurosci. 18, 498–509 (2017). - PubMed
    1. Sivaselvachandran S., Acland E. L., Abdallah S., Martin L. J., Behavioral and mechanistic insight into rodent empathy. Neurosci. Biobehav. Rev. 91, 130–137 (2018). - PubMed
    1. Keysers C., Knapska E., Moita M. A., Gazzola V., Emotional contagion and prosocial behavior in rodents. Trends Cogn. Sci. 26, 688–706 (2022). - PubMed
    1. Wu Y. E., Hong W., Neural basis of prosocial behavior. Trends Neurosci. 45, 749–762 (2022). - PMC - PubMed
    1. Wu Y. E., Dang J., Kingsbury L., Zhang M., Sun F., Hu R. K., Hong W., Neural control of affiliative touch in prosocial interaction. Nature 599, 262–267 (2021). - PMC - PubMed

LinkOut - more resources