

Mass Spectrometry-Based Spatial Multiomics Revealed Bioaccumulation Preference and Region-Specific Responses of PFOS in Mice Cardiac Tissue
- PMID: 39841981
- PMCID: PMC11800377
- DOI: 10.1021/acs.est.4c09874
Mass Spectrometry-Based Spatial Multiomics Revealed Bioaccumulation Preference and Region-Specific Responses of PFOS in Mice Cardiac Tissue
Abstract
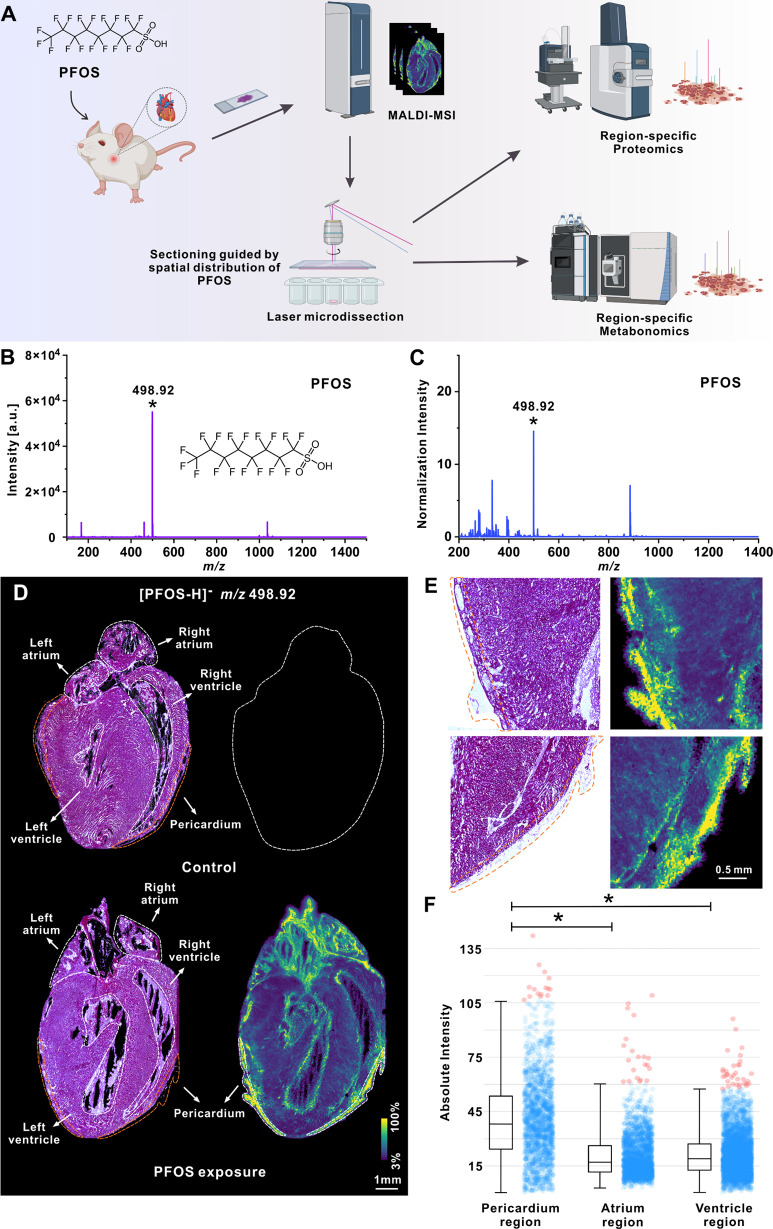
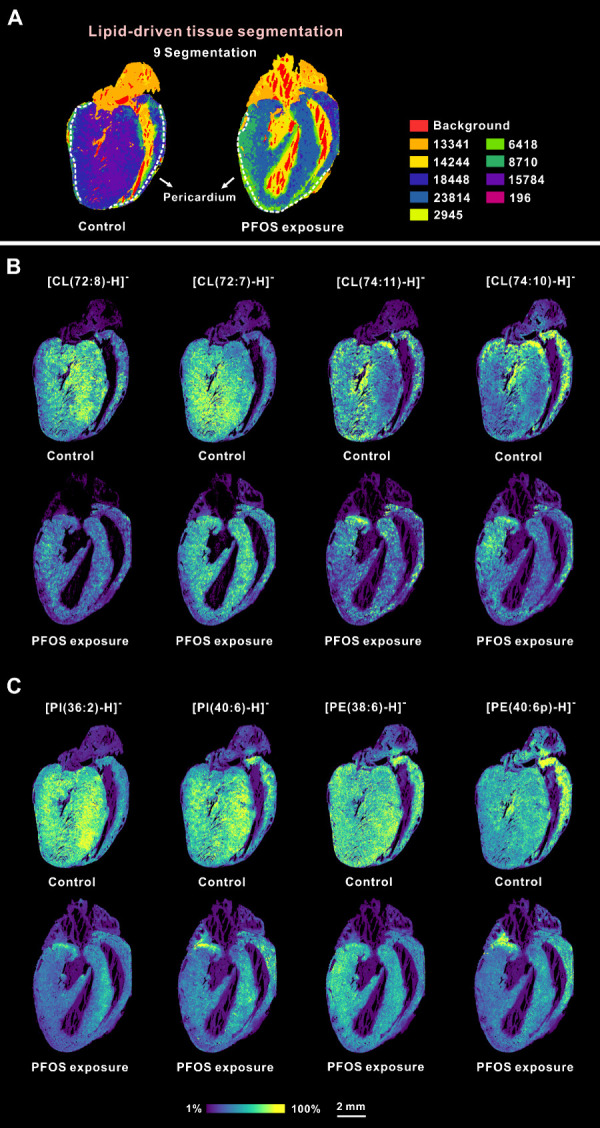
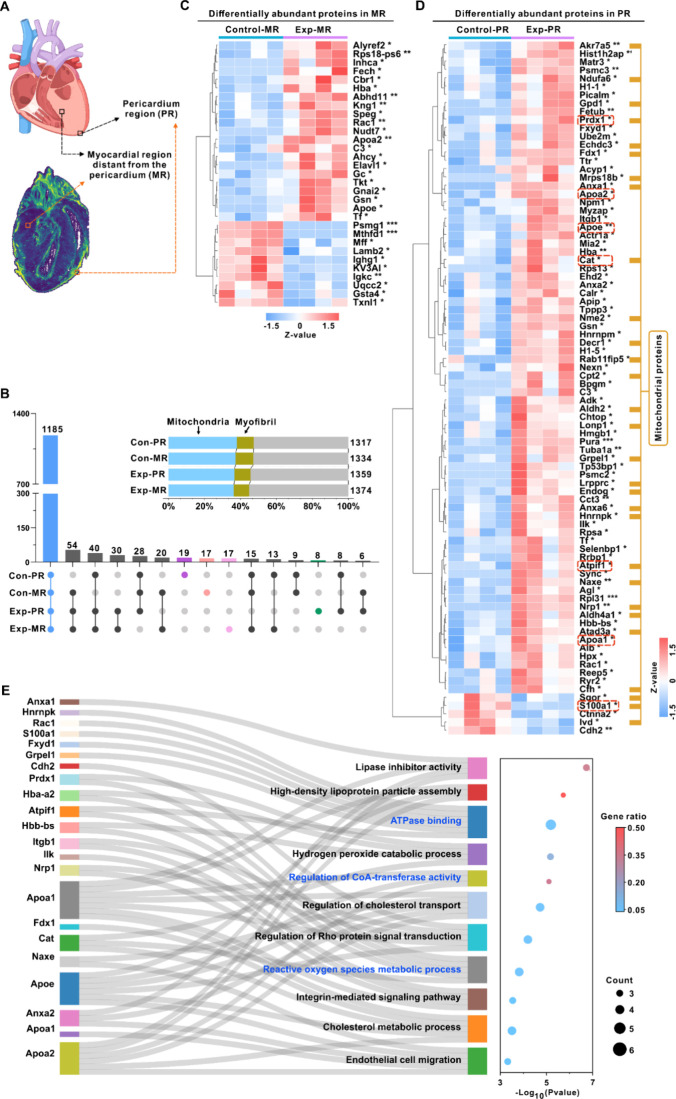
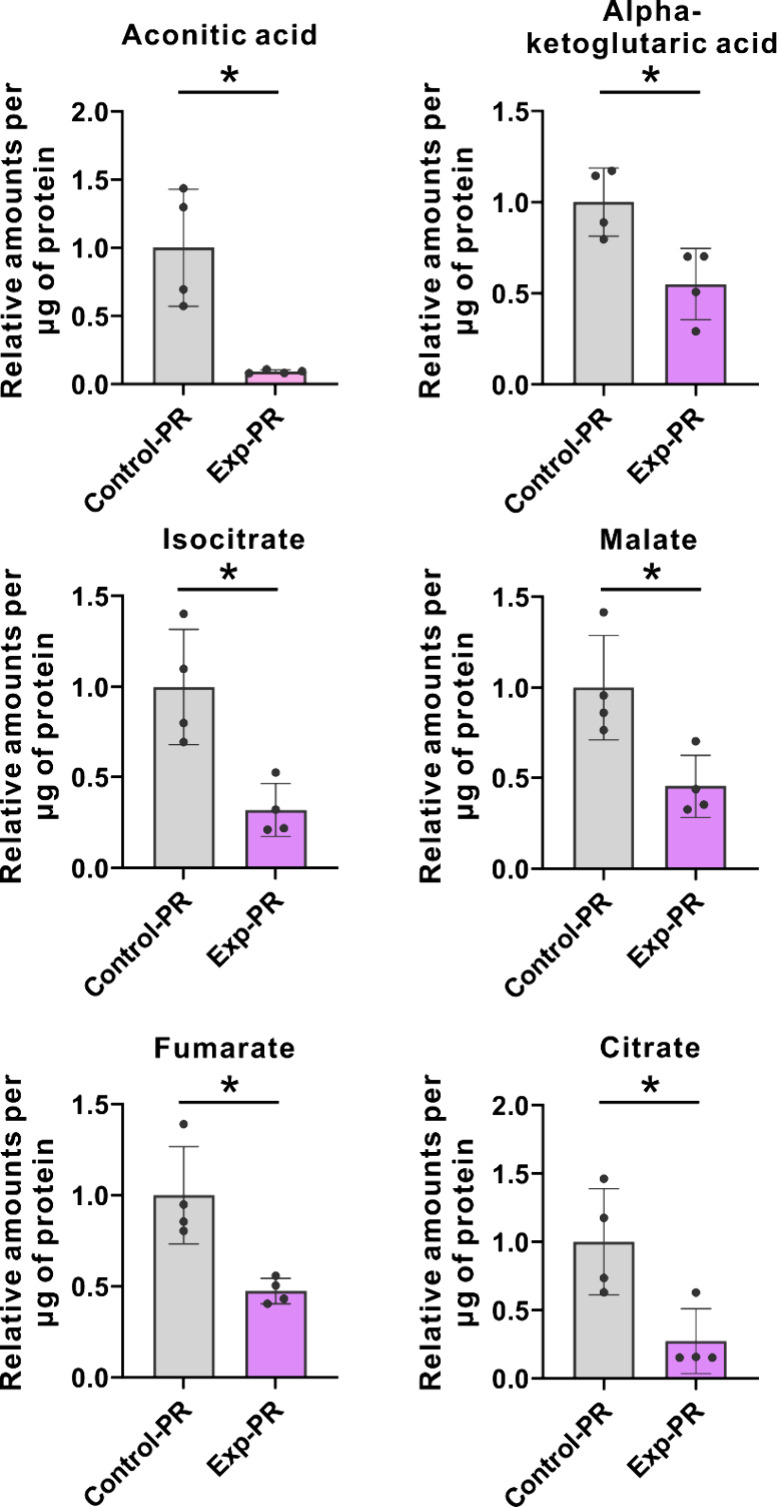
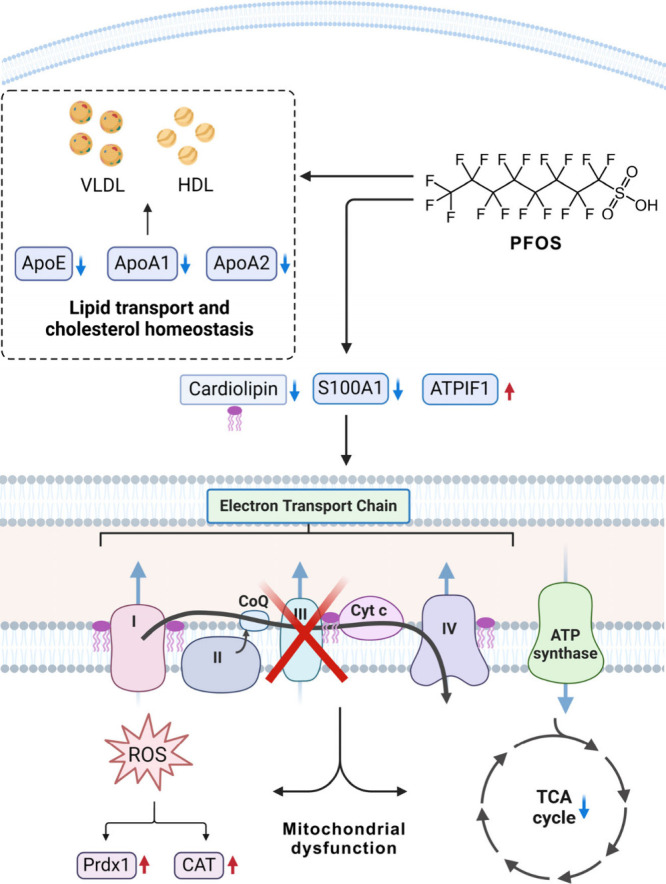
The distribution and bioaccumulation of environmental pollutants are essential to understanding their toxicological mechanism. However, achieving spatial resolution at the subtissue level is still challenging. Perfluorooctanesulfonate (PFOS) is a persistent environmental pollutant with widespread occurrence. The bioaccumulation behavior of PFOS is complicated by its dual affinity for phospholipids and protein albumin. It is intriguing to visualize the distribution preference of PFOS and investigate the differential microenvironment responses at a subtissue level. Herein, we developed a mass-spectrometry (MS)-based spatial multiomics workflow, integrating matrix-assisted laser desorption/ionization MS imaging, laser microdissection, and liquid chromatography MS analysis. This integrated workflow elucidates the spatial distribution of PFOS in mouse cardiac tissue, highlighting its preferential accumulation in the pericardium over the myocardium. This distribution pattern results in greater toxicity to the pericardium, significantly altering cardiolipin levels and disrupting energy metabolism and lipid transport pathways. Our integrated approach provides novel insights into the bioaccumulation behavior of PFOS and demonstrates significant potential for revealing complex molecular mechanisms underlying the health impacts of environmental pollutants.
Keywords: Mass spectrometry analysis; PFOS; bioaccumulation; mass spectrometry imaging; spatial proteomics.
Conflict of interest statement
The authors declare no competing financial interest.
Figures
Similar articles
-
In Situ Detection and Imaging of PFOS in Mouse Kidney by Matrix-Assisted Laser Desorption/Ionization Imaging Mass Spectrometry.Anal Chem. 2019 Jul 16;91(14):8783-8788. doi: 10.1021/acs.analchem.9b00711. Epub 2019 Jun 28. Anal Chem. 2019. PMID: 31251037
-
Current understanding of human bioaccumulation patterns and health effects of exposure to perfluorooctane sulfonate (PFOS).J Hazard Mater. 2025 Apr 5;487:137249. doi: 10.1016/j.jhazmat.2025.137249. Epub 2025 Jan 16. J Hazard Mater. 2025. PMID: 39842114 Review.
-
Time-dependent biomolecular responses and bioaccumulation of perfluorooctane sulfonate (PFOS) in Daphnia magna.Comp Biochem Physiol Part D Genomics Proteomics. 2020 Sep;35:100701. doi: 10.1016/j.cbd.2020.100701. Epub 2020 May 26. Comp Biochem Physiol Part D Genomics Proteomics. 2020. PMID: 32505104
-
Spatially revealed perfluorooctane sulfonate-induced nephrotoxicity in mouse kidney using atmospheric pressure MALDI mass spectrometry imaging.Sci Total Environ. 2022 Sep 10;838(Pt 3):156380. doi: 10.1016/j.scitotenv.2022.156380. Epub 2022 May 31. Sci Total Environ. 2022. PMID: 35660446
-
[Application of multiomics mass spectrometry in the research of chemical exposome].Se Pu. 2024 Feb;42(2):120-130. doi: 10.3724/SP.J.1123.2023.10001. Se Pu. 2024. PMID: 38374592 Free PMC article. Review. Chinese.
Cited by
-
A Comprehensive, Simple, Robust, and Solvent-Free Method Covering Ultrashort- to Long-Chain PFAS in Atmospheric Samples.Anal Chem. 2025 Jul 15;97(27):14838-14846. doi: 10.1021/acs.analchem.5c03123. Epub 2025 Jul 1. Anal Chem. 2025. PMID: 40598762 Free PMC article.
References
-
- Evich M. G.; Davis M. J. B.; McCord J. P.; Acrey B.; Awkerman J. A.; Knappe D. R. U.; Lindstrom A. B.; Speth T. F.; Tebes-Stevens C.; Strynar M. J.; Wang Z.; Weber E. J.; Henderson W. M.; Washington J. W. Per- and polyfluoroalkyl substances in the environment. Science 2022, 375, eabg906510.1126/science.abg9065. - DOI - PMC - PubMed
-
- Guelfo J. L.; Ferguson P. L.; Beck J.; Chernick M.; Doria-Manzur A.; Faught P. W.; Flug T.; Gray E. P.; Jayasundara N.; Knappe D. R. U.; Joyce A. S.; Meng P.; Shojaei M. Lithium-ion battery components are at the nexus of sustainable energy and environmental release of per- and polyfluoroalkyl substances. Nat. Commun. 2024, 15, 5548.10.1038/s41467-024-49753-5. - DOI - PMC - PubMed
-
- Wee S. Y.; Aris A. Z. Revisiting the “forever chemicals”, PFOA and PFOS exposure in drinking water. npj Clean Water 2023, 6, 57.10.1038/s41545-023-00274-6. - DOI
MeSH terms
Substances
LinkOut - more resources
Full Text Sources
