

Discrimination of Radiologists' Experience Level Using Eye-Tracking Technology and Machine Learning: Case Study
- PMID: 39842001
- PMCID: PMC11799805
- DOI: 10.2196/53928
Discrimination of Radiologists' Experience Level Using Eye-Tracking Technology and Machine Learning: Case Study
Abstract
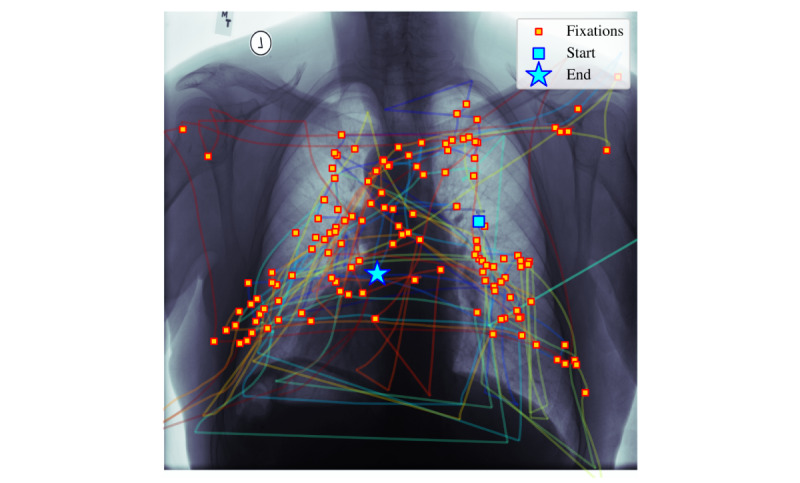
Background: Perception-related errors comprise most diagnostic mistakes in radiology. To mitigate this problem, radiologists use personalized and high-dimensional visual search strategies, otherwise known as search patterns. Qualitative descriptions of these search patterns, which involve the physician verbalizing or annotating the order he or she analyzes the image, can be unreliable due to discrepancies in what is reported versus the actual visual patterns. This discrepancy can interfere with quality improvement interventions and negatively impact patient care.
Objective: The objective of this study is to provide an alternative method for distinguishing between radiologists by means of captured eye-tracking data such that the raw gaze (or processed fixation data) can be used to discriminate users based on subconscious behavior in visual inspection.
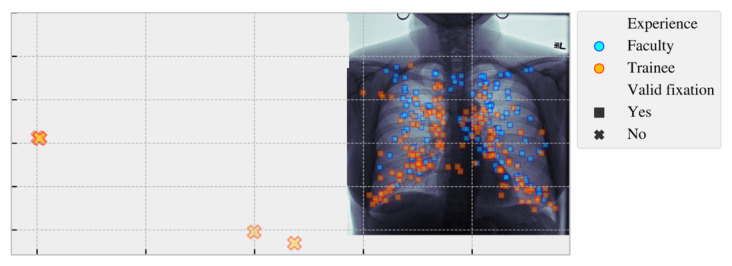
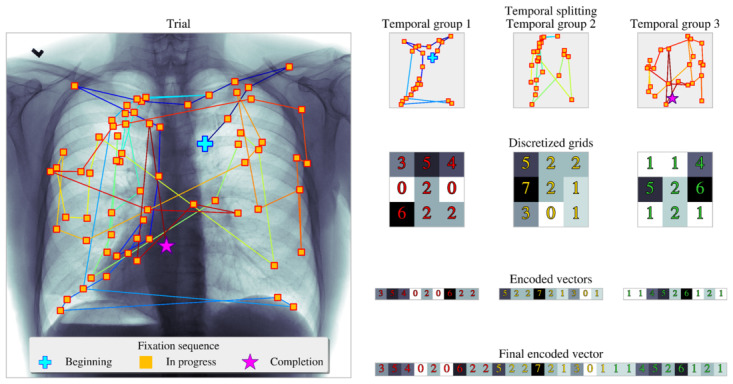
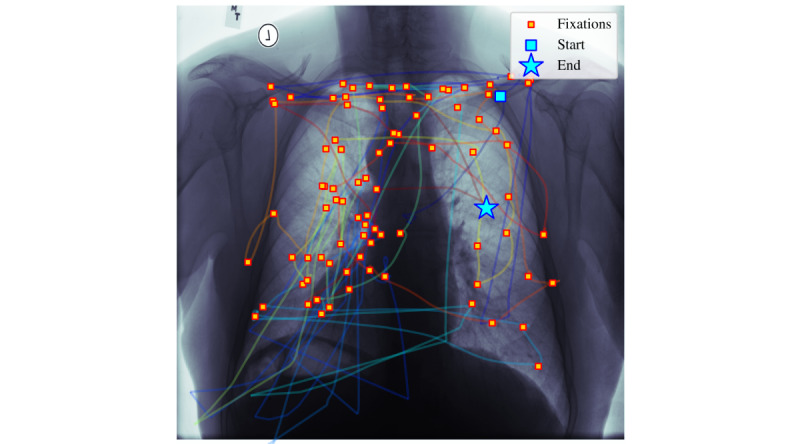
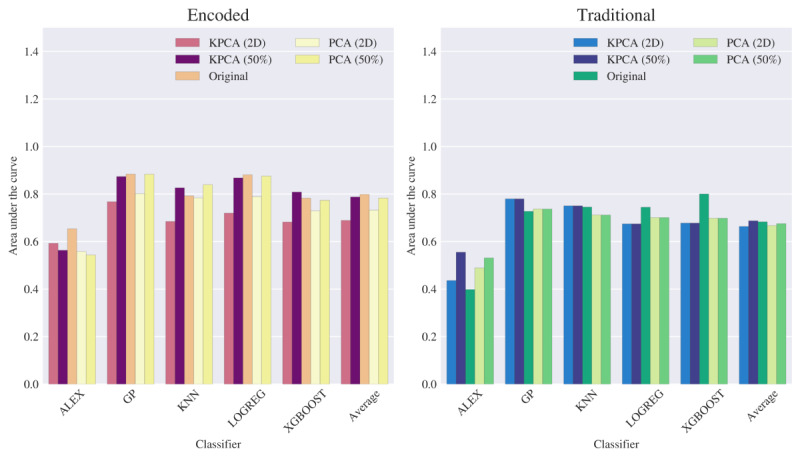
Methods: We present a novel discretized feature encoding based on spatiotemporal binning of fixation data for efficient geometric alignment and temporal ordering of eye movement when reading chest x-rays. The encoded features of the eye-fixation data are used by machine learning classifiers to discriminate between faculty and trainee radiologists. A clinical trial case study was conducted using metrics such as the area under the curve, accuracy, F1-score, sensitivity, and specificity to evaluate the discriminability between the 2 groups regarding their level of experience. The classification performance was then compared with state-of-the-art methodologies. In addition, a repeatability experiment using a separate dataset, experimental protocol, and eye tracker was performed with 8 participants to evaluate the robustness of the proposed approach.
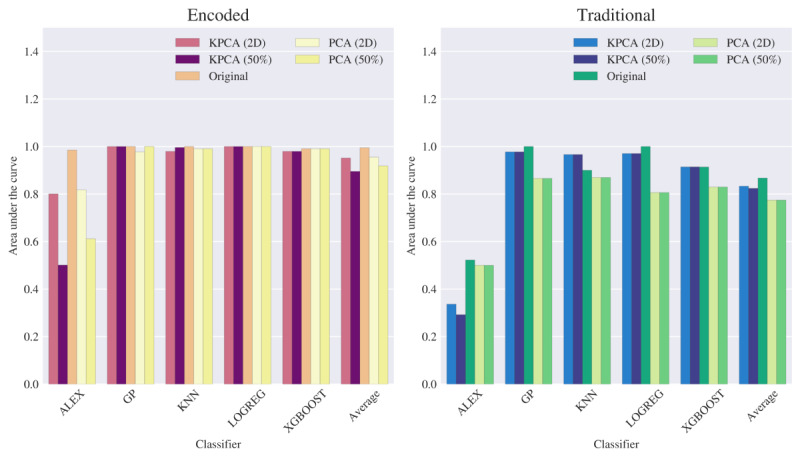
Results: The numerical results from both experiments demonstrate that classifiers using the proposed feature encoding methods outperform the current state-of-the-art in differentiating between radiologists in terms of experience level. An average performance gain of 6.9% is observed compared with traditional features while classifying experience levels of radiologists. This gain in accuracy is also substantial across different eye tracker-collected datasets, with improvements of 6.41% using the Tobii eye tracker and 7.29% using the EyeLink eye tracker. These results signify the potential impact of the proposed method for identifying radiologists' level of expertise and those who would benefit from additional training.
Conclusions: The effectiveness of the proposed spatiotemporal discretization approach, validated across diverse datasets and various classification metrics, underscores its potential for objective evaluation, informing targeted interventions and training strategies in radiology. This research advances reliable assessment tools, addressing challenges in perception-related errors to enhance patient care outcomes.
Keywords: classification; education; experience; experience level determination; eye movement; eye-tracking; fixation; gaze; image; machine learning; radiology; radiology education; search pattern; search pattern feature extraction; spatio-temporal; x-ray.
©Stanford Martinez, Carolina Ramirez-Tamayo, Syed Hasib Akhter Faruqui, Kal Clark, Adel Alaeddini, Nicholas Czarnek, Aarushi Aggarwal, Sahra Emamzadeh, Jeffrey R Mock, Edward J Golob. Originally published in JMIR Formative Research (https://formative.jmir.org), 22.01.2025.
Conflict of interest statement
Conflicts of Interest: KC holds equity in Zauron Labs Inc and NC is a co-owner of Zauron Labs.
Figures

References
-
- An update on cancer deaths in the United States. Centers for Disease Control and Prevention. 2022. Feb 28, [2022-02-28]. https://stacks.cdc.gov/view/cdc/119728 .
-
- Screening for lung caner: U.S. Preventitive Services Task Force recommendation statement. Lung Cancer Research foundation. 2014. [2024-09-23]. https://www.lungcancerresearchfoundation.org/screening-for-lung-cancer-u...
-
- Waite S, Grigorian A, Alexander RG, Macknik SL, Carrasco M, Heeger DJ, Martinez-Conde S. Analysis of perceptual expertise in radiology - current knowledge and a new perspective. Front Hum Neurosci. 2019;13:213. doi: 10.3389/fnhum.2019.00213. https://europepmc.org/abstract/MED/31293407 - DOI - PMC - PubMed
-
- Kundel HL. Perception errors in chest radiography. Seminars in Respiratory Medicine. 1989;10(03):203–210. doi: 10.1055/s-2007-1006173. - DOI
MeSH terms
LinkOut - more resources
Full Text Sources
