. 2025 Mar:253:104703.
doi: 10.1016/j.actpsy.2025.104703. Epub 2025 Jan 21.

Risky actions: Why and how to estimate variability in motor performance

Affiliations

Risky actions: Why and how to estimate variability in motor performance

John M Franchak et al. Acta Psychol (Amst). 2025 Mar.

Abstract

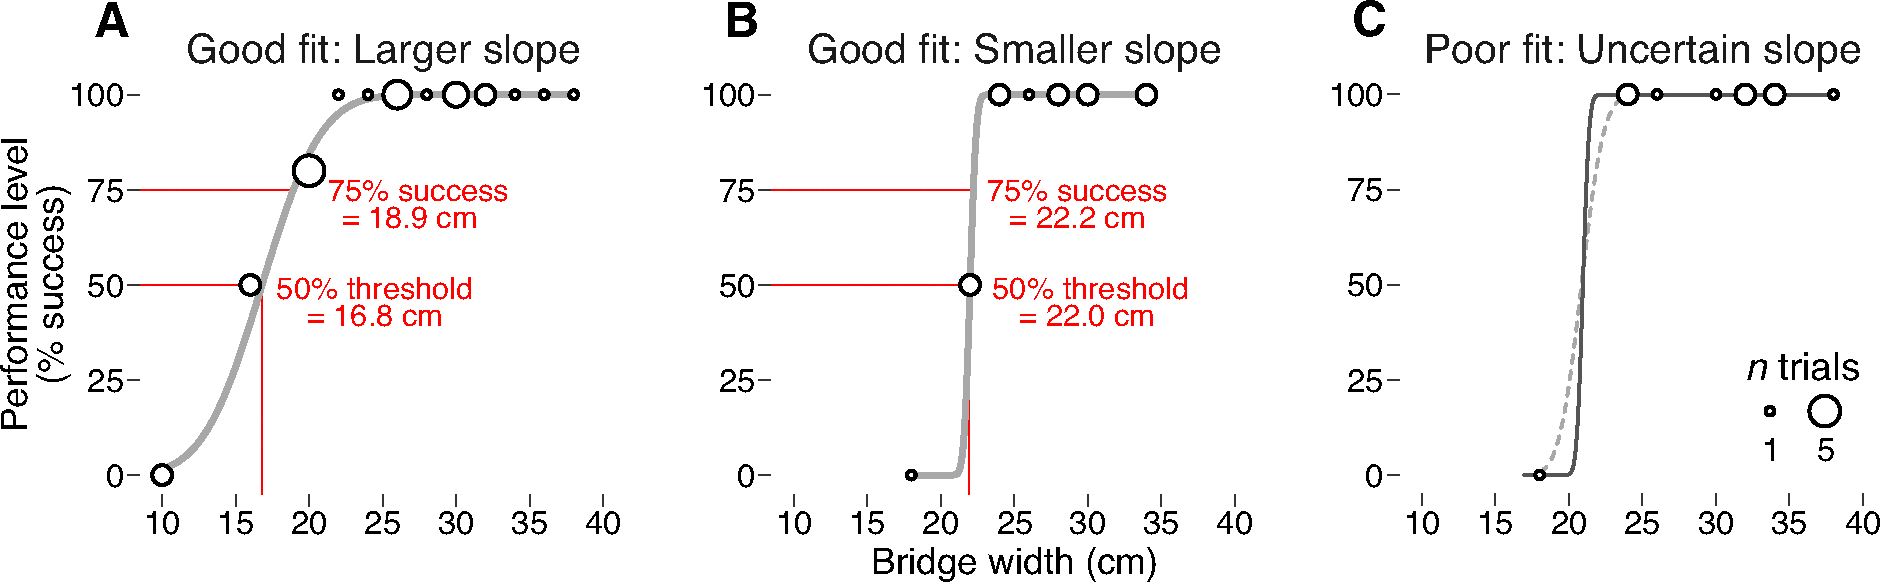
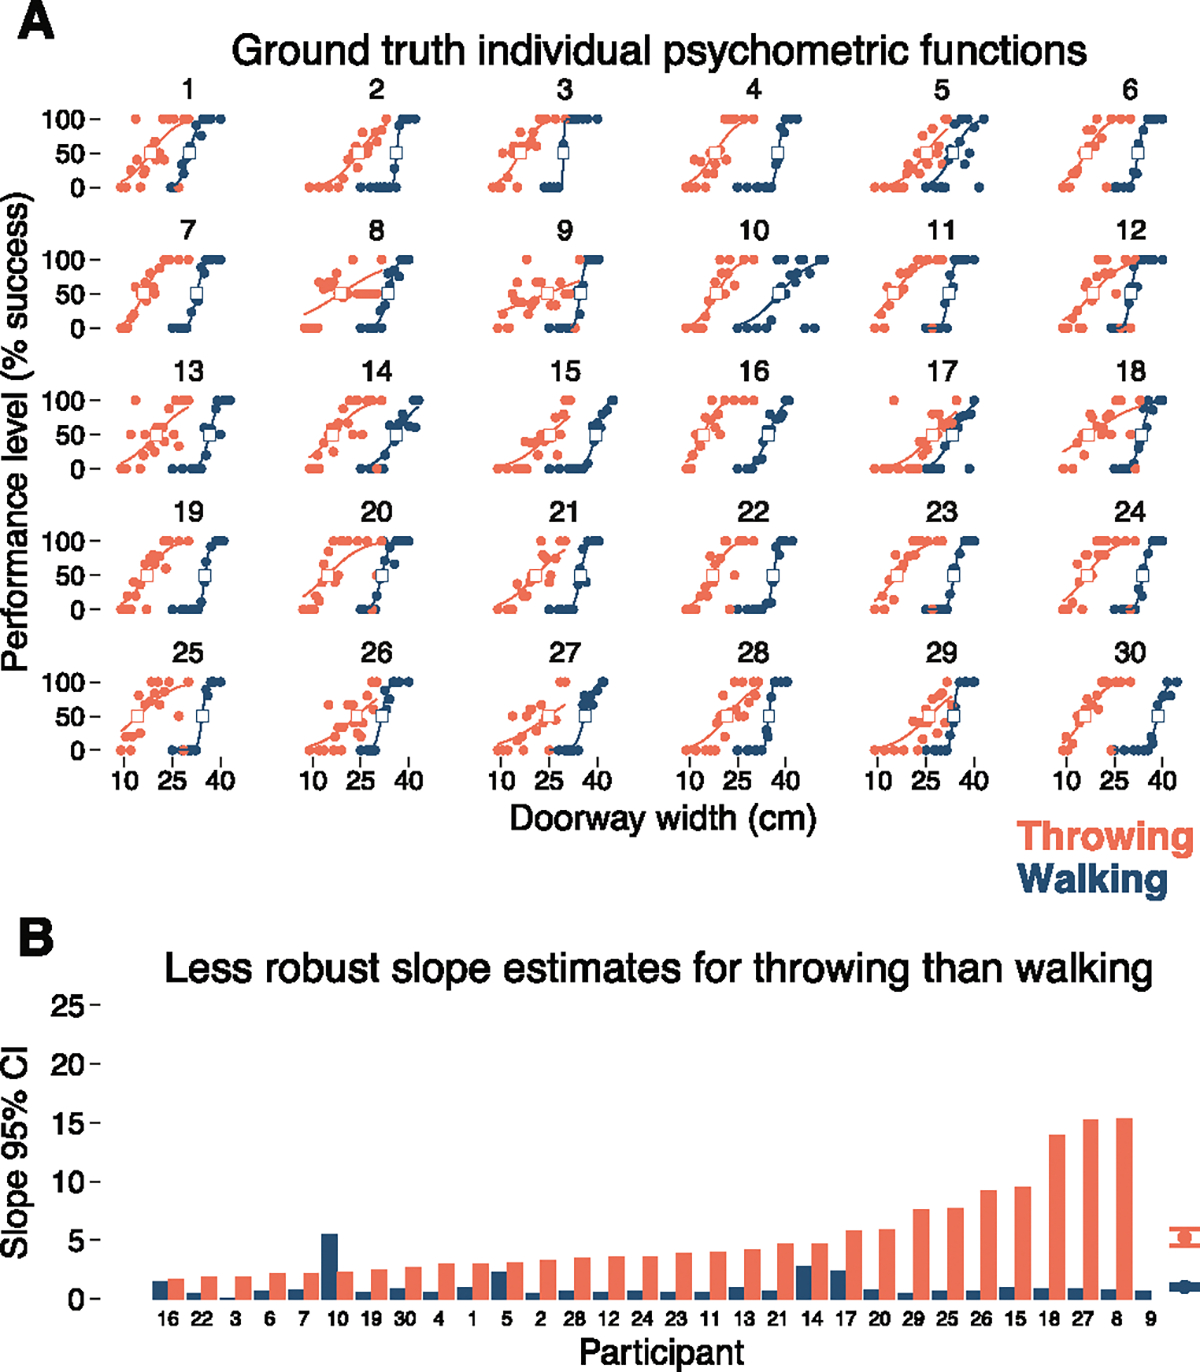
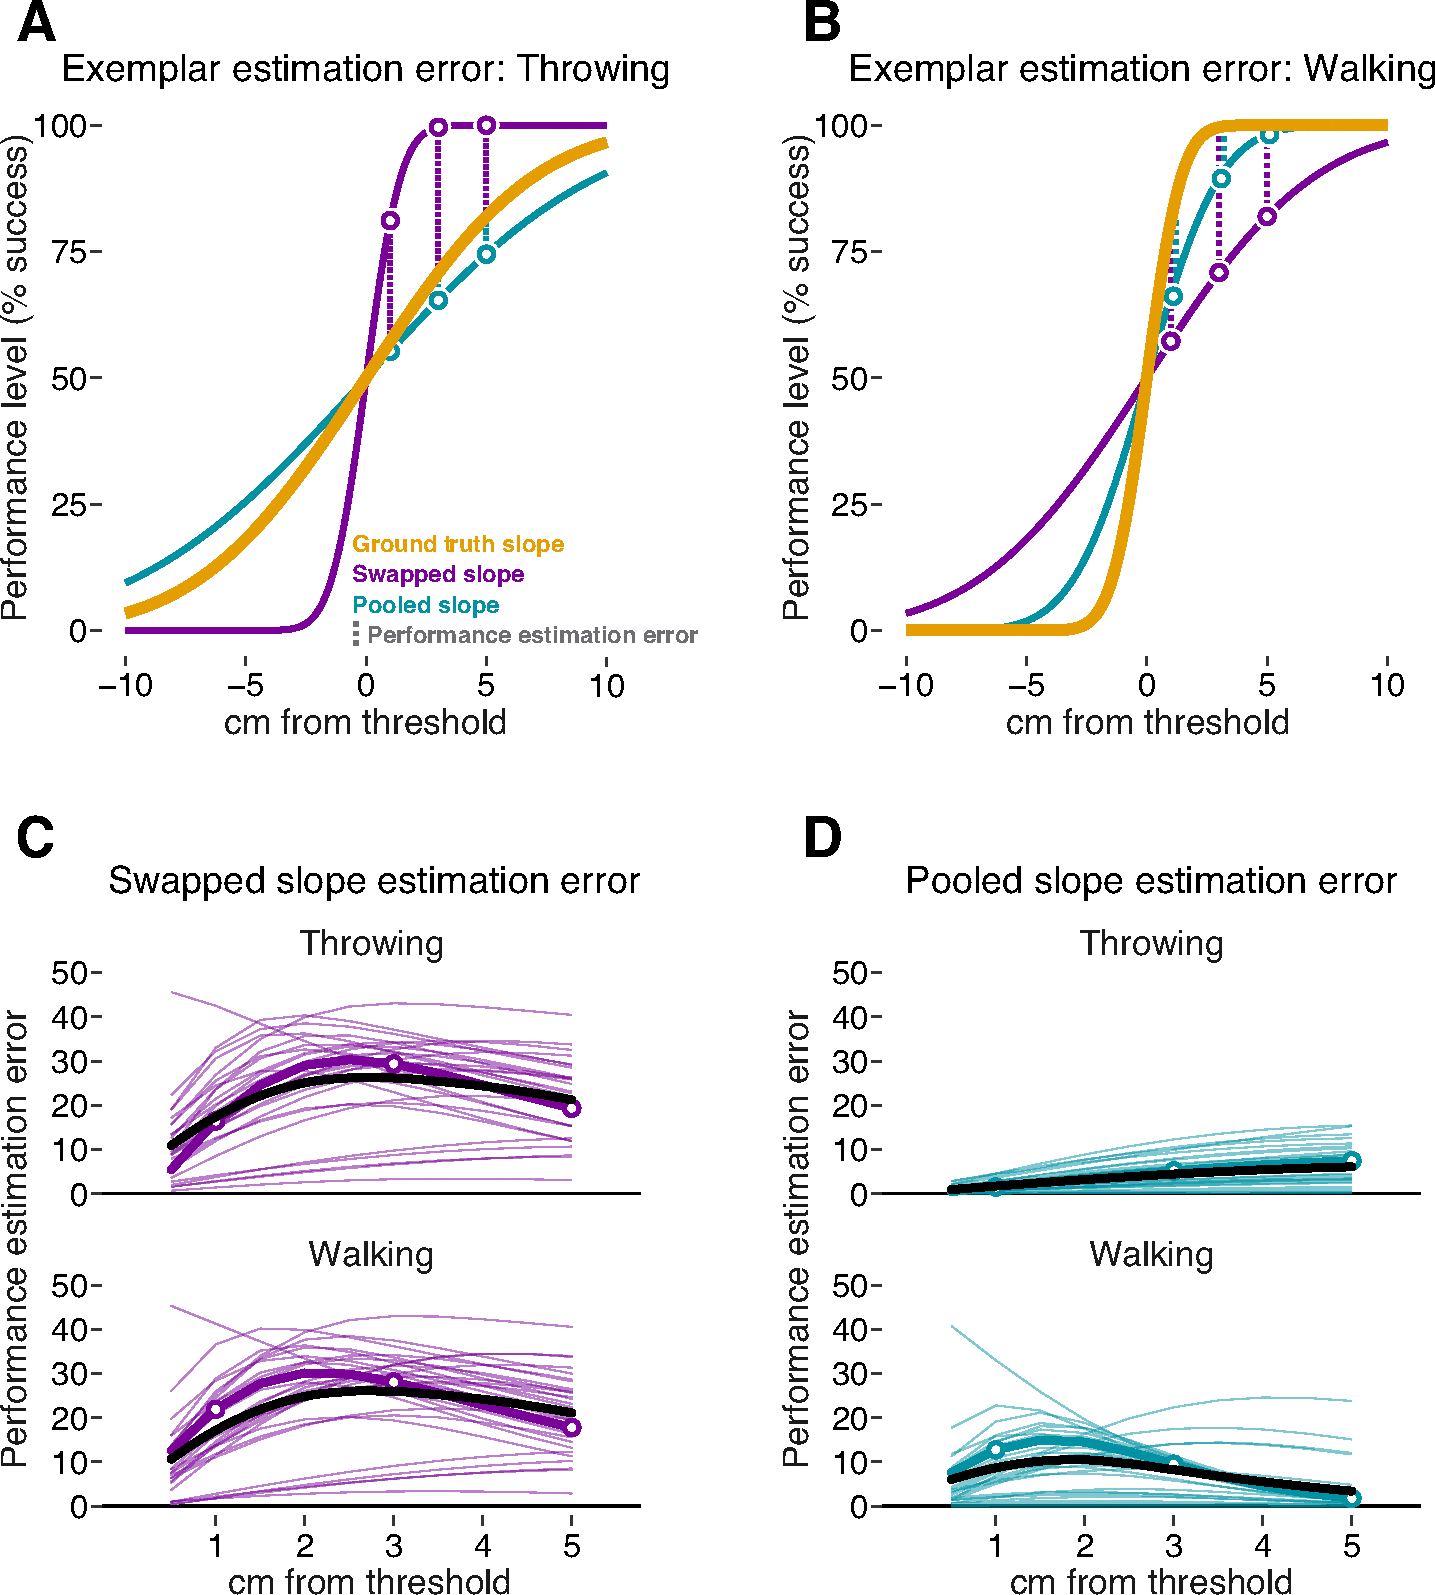
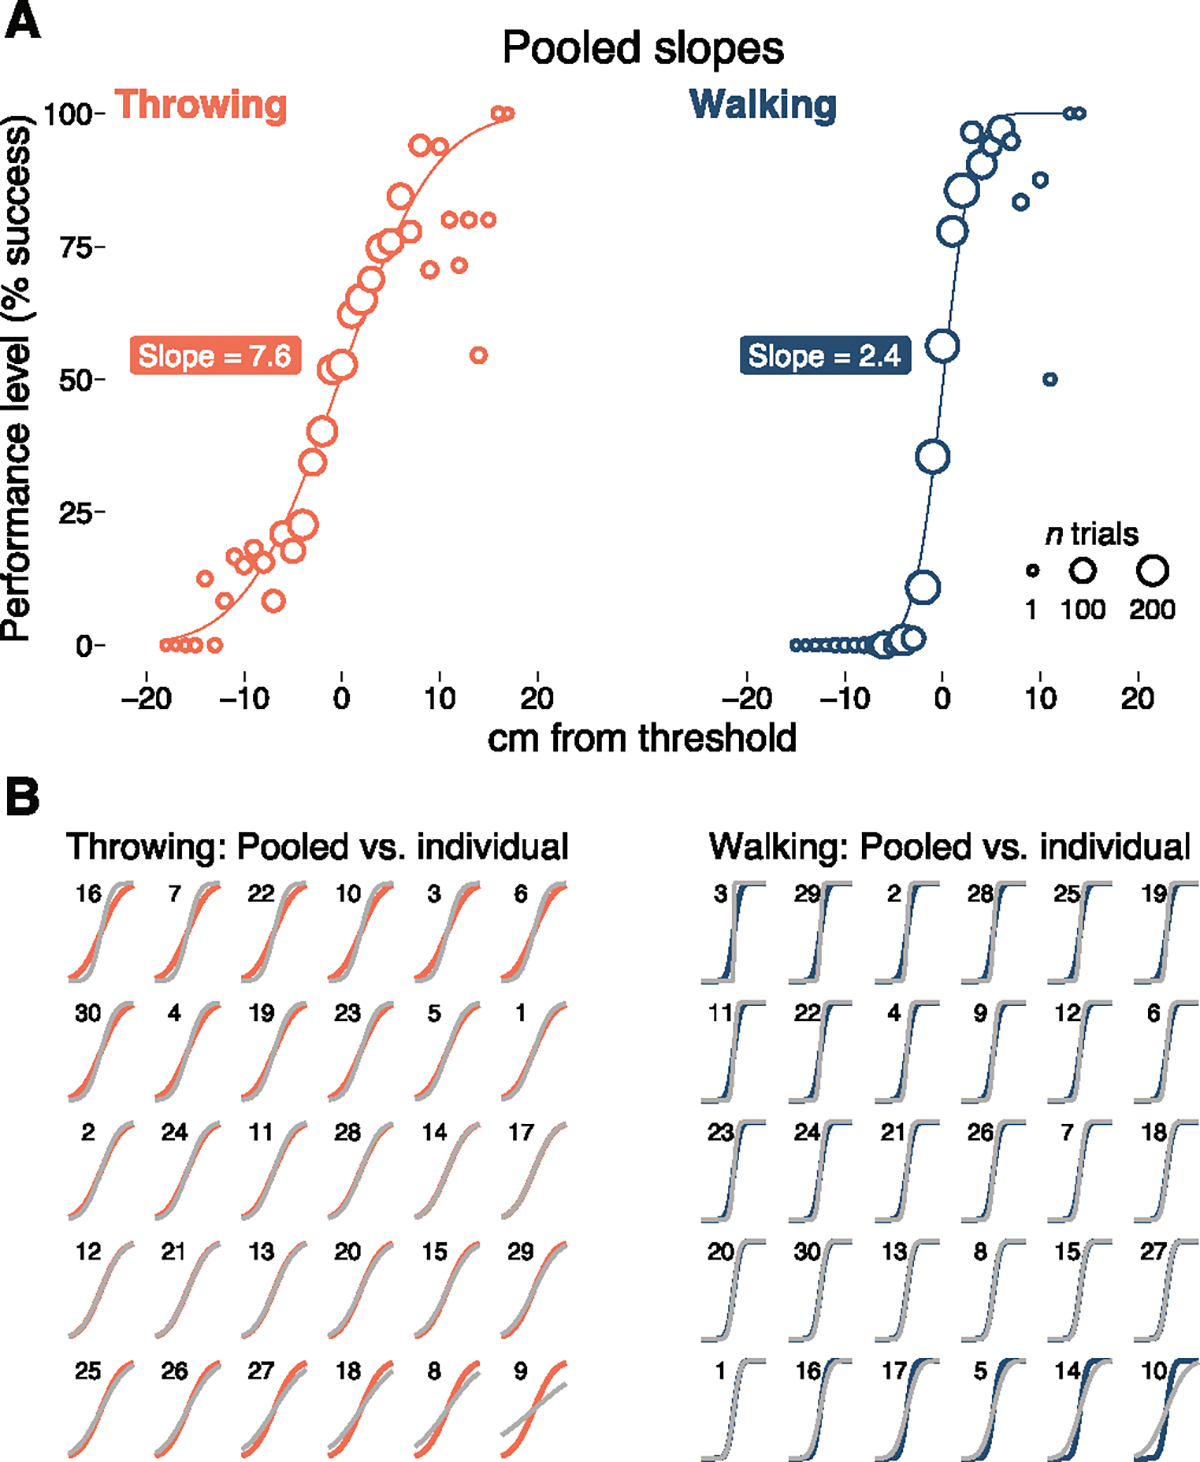
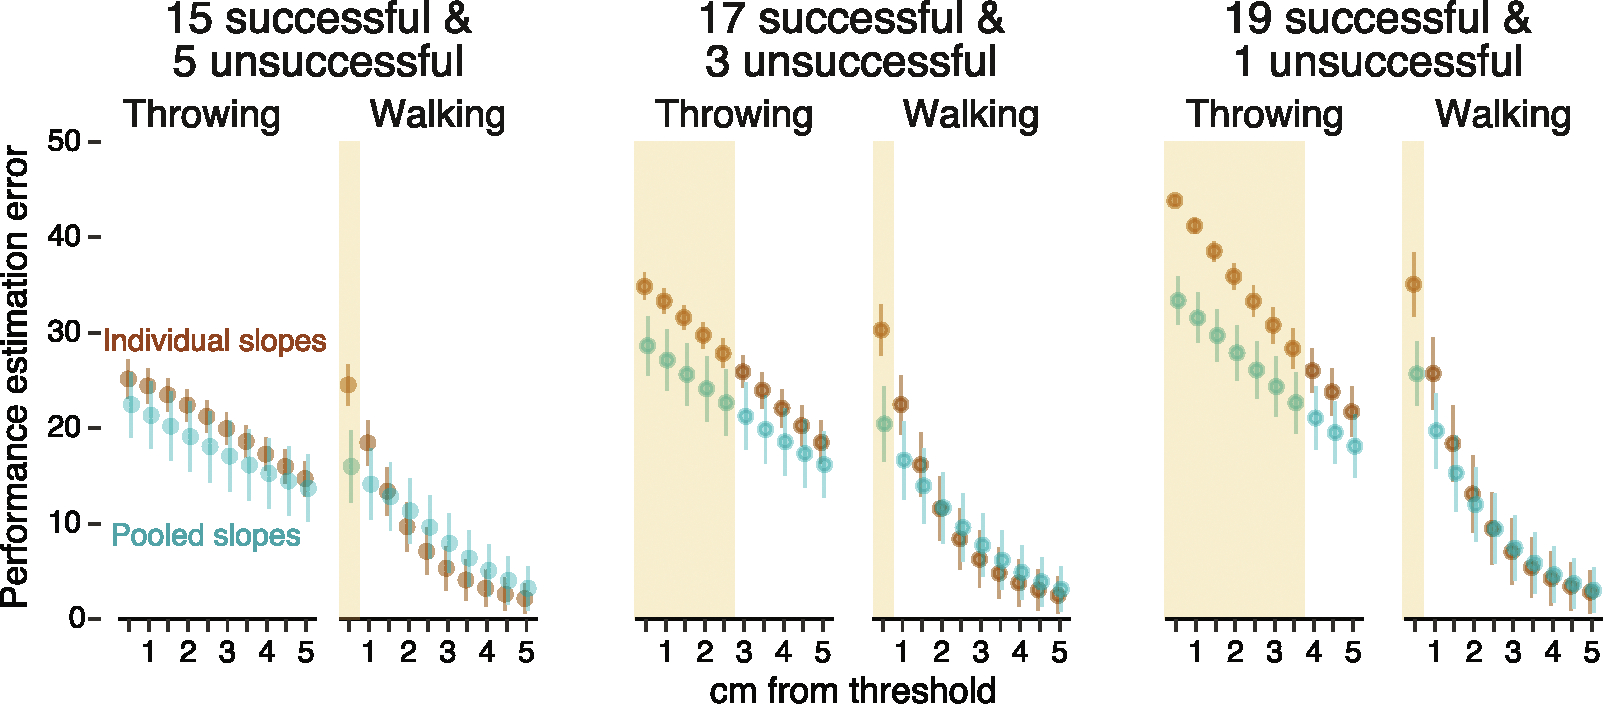
We describe the difficulties of measuring variability in performance, a critical but largely ignored problem in studies of risk perception. The problem seems intractable if a large number of successful and unsuccessful trials are infeasible. We offer a solution based on estimates of task-specific variability pooled across the sample. Using a dataset of adult performance in throwing and walking tasks, we show that mischaracterizing the slope leads to unacceptably large errors in estimates of performance levels that undermine analyses of risk perception. We introduce a "pooled-slope" solution that approximates estimates of individual variability in performance and outperforms arbitrary assumptions about performance variability within and across tasks. We discuss the advantages of objectively measuring performance based on the rate of successful attempts-modeled via psychometric functions-for improving comparisons of risk across participants, tasks, and studies.

Keywords: Affordances; Motor performance; Psychometric; Psychophysics; Risk estimation; Risk perception.


Conflict of interest statement

Declaration of competing interest John M. Franchak – I have nothing to declare. Christina M. Hospodar – I have nothing to declare. Karen E. Adolph – I have nothing to declare.

Figures

Fig. 1.
Fig. 1.
Examples of psychometric functions for data from three infants walking over bridges in Kretch and Adolph (2013b). Each graph shows the percentage of successful trials (y-axis) at various bridge widths (x-axis). Symbol size is scaled to the number of trials collected at each bridge width. Gray lines are the individual psychometric functions. (A) Good curve fit with relatively large slope (flatter function). (B) Good curve fit with relatively smaller slope (steeper function). Red reference lines show the thresholds (environmental unit with 50 % success rate). Difference between thresholds and 75 % success rate illustrate that performance depends on the size of each infant’s slope. When the slope is large as in (A), the difference is 2.1 cm, but when the slope is small as in (B), the difference is only 0.2 cm. (C) Dataset with only a single failure leading to an uncertain slope—both smaller (i.e., black line) and larger (i.e., gray dashed line) slope estimates are possible fits to the data. (For interpretation of the references to colour in this figure legend, the reader is referred to the web version of this article.)
Fig. 2.
Fig. 2.
Data from the throwing/walking task in Hospodar et al. (2023). (A) Individual psychometric functions fit to each participant’s data in the throwing (orange) and walking (blue) tasks. Symbols show the percent of successful trials (y-axis) at each doorway width (x-axis). White squares indicate the threshold estimates. (B) Relation between performance variability and robustness of slope estimates. Each bar indicates the size of the 95 % confidence interval for the slope parameter for each participant in each task calculated from bootstrap resampling. Confidence intervals were larger (worse) for throwing compared to walking. Points to the right of the bar graphs indicate group-level means with ±1 SE error bars. (For interpretation of the references to colour in this figure legend, the reader is referred to the web version of this article.)
Fig. 3.
Fig. 3.
Performance estimation error (calculated as the absolute difference in percent success compared to ground truth estimates). (A) Throwing and (B) walking. One participant’s (#4) percent success (y-axis) at different cm from threshold (x-axis) for the ground truth psychometric function (gold line), the swapped slope psychometric function (purple line), and the pooled slope psychometric function (teal line). The length of the dashed lines in (A) and (B) at 1, 3, and 5 cm show examples of performance estimation error for swapped slopes and pooled slopes. In each case, performance estimation error was larger for swapped slopes than for pooled slopes. (C) Each participant’s performance estimation error for throwing and walking for the swapped slope estimates (thin purple lines). (D) Each participant’s performance estimation error for throwing and walking for the pooled slope estimates (thin teal lines). White circles and thick purple or teal lines denote the performance estimation error from exemplar participant #4 in (A) and (B). Black lines indicate the mean performance estimation error across participants. (For interpretation of the references to colour in this figure legend, the reader is referred to the web version of this article.)
Fig. 4.
Fig. 4.
Pooled slopes for each task. (A) Each participant’s data were centered based on their individual thresholds for each task and then rounded to integer units. Each symbol reflects the percent of successful trials in the pooled data after pooling across participants; symbol size was scaled to the number of trials. A single psychometric function in each condition yielded a pooled slope used in subsequent analyses. (B) Pooled slopes (orange and blue curves) relative to each participant’s psychometric function for throwing and walking (gray curves). Participants’ data were ordered from smallest to largest ground truth slope parameter (i.e., gray curves). (For interpretation of the references to colour in this figure legend, the reader is referred to the web version of this article.)
Fig. 5.
Fig. 5.
Performance estimation errors for pooled slopes and ground-truth estimates in infant-inspired datasets with a small number of trials and unsuccessful trials. Average performance estimation error of individual fits to degraded data (brown points) compared with pooled-slope estimations (teal points) with 95 % confidence intervals. Each panel shows a different degraded dataset pulling n = 20 random trials from each participant’s data in each task: 15 successful and 5 unsuccessful trials (left), 17 successful and 3 unsuccessful trials (center), and 19 successful and 1 unsuccessful trial (right). Yellow shading denotes cases where the pooled slope outperformed individual psychometric functions (non-overlapping confidence intervals). In every non-shaded case, the pooled slope was comparable to individual psychometric functions (overlapping confidence intervals). (For interpretation of the references to colour in this figure legend, the reader is referred to the web version of this article.)

Similar articles

References

    1. Adolph KE (1995). Psychophysical assessment of toddlers’ ability to cope with slopes. Journal of Experimental Psychology: Human Perception and Performance, 21, 734–750. - PubMed
    1. Adolph KE (2019). An ecological approach to learning in (not and) development. Human Development, 63, 180–201. - PMC - PubMed
    1. Cole WG, Chan GLY, Vereijken B, & Adolph KE (2013). Perceiving affordances for different motor skills. Experimental Brain Research, 225, 309–319. - PMC - PubMed
    1. Comalli DM, Franchak JM, Char A, & Adolph KE (2013). Ledge and wedge: Younger and older adults’ perception of action possibilities. Experimental Brain Research, 228, 183–192. 10.1007/s00221-013-3550-0 - DOI - PMC - PubMed
    1. Comalli DM, Persand D, & Adolph KE (2017). Motor decisions are not black and white: Selecting actions in the ‘gray zone’. Experimental Brain Research, 235, 1793–1807. - PMC - PubMed