Review
. 2025 Jan 23;380(1918):20230336.
doi: 10.1098/rstb.2023.0336. Epub 2025 Jan 23.

Time to start taking time seriously: how to investigate unexpected biological rhythms within infectious disease research

Affiliations
Review

Time to start taking time seriously: how to investigate unexpected biological rhythms within infectious disease research

Rachel S Edgar et al. Philos Trans R Soc Lond B Biol Sci. .

Abstract

The discovery of rhythmicity in host and pathogen activities dates back to the Hippocratic era, but the causes and consequences of these biological rhythms have remained poorly understood. Rhythms in infection phenotypes or traits are observed across taxonomically diverse hosts and pathogens, suggesting general evolutionary principles. Understanding these principles may enable rhythms to be leveraged in manners that improve drug and vaccine efficacy or disrupt pathogen timekeeping to reduce virulence and transmission. Explaining and exploiting rhythms in infections require an integrative and multidisciplinary approach, which is a hallmark of research within chronobiology. Many researchers are welcomed into chronobiology from other fields after observing an unexpected rhythm or time-of-day effect in their data. Such findings can launch a rich new research topic, but engaging with the concepts, approaches and dogma in a new discipline can be daunting. Fortunately, chronobiology has well-developed frameworks for interrogating rhythms that can be readily applied in novel contexts. Here, we provide a 'how to' guide for exploring unexpected daily rhythms in infectious disease research. We outline how to establish: whether the rhythm is circadian, to what extent the host and pathogen are responsible, the relevance for host-pathogen interactions, and how to explore therapeutic potential.This article is part of the Theo Murphy meeting issue 'Circadian rhythms in infection and immunity'.

Keywords: circadian clock; fitness; host–parasite interaction; immune response; rhythms; seasonal.


Conflict of interest statement

The authors declare that the research was conducted in the absence of any commercial or financial relationships that could be construed as a potential conflict of interest.

Figures
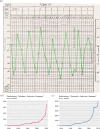
Historical and recent medical and scientific relevance.
Figure 1.
Historical and recent medical and scientific relevance. (a) Daily temperature rhythm data from a malaria-infected patient in 1901, collected as part of symptom monitoring to assess antimalarial treatment effects [1] . Upsurge in publications addressing (b) circadian/daily and (c) seasonal rhythms in infection and immunity, highlighting that seasonal rhythms are more often studied. Graphs depict the numbers of studies published each year from 1940 to 2020 (Source: PubMed search, https://pubmed.ncbi.nlm.nih.gov).
Schematic of methodologies used to interrogate rhythms in infections.
Figure 2.
Schematic of methodologies used to interrogate rhythms in infections. (a) Environmental factors and host–pathogen rhythms explored in this issue: environmental factors influence the intrinsic circadian clocks of hosts or/and pathogens and response systems to the pathogen. These factors regulate rhythmic activities in both host and pathogen (e.g. immune responses, pathogen replication), affecting infection dynamics. Understanding these interactions is critical in the field of chronopathology, which investigates how rhythms in hosts and pathogens impact disease outcomes and treatment effectiveness. (b) Defining rhythmicity: a biological rhythm is characterized by period, phase and amplitude (see table A1 for definitions). Alterations in pathogen rhythms relative to host rhythms can influence infection outcomes over a 24-h cycle. (c) Manipulating rhythms: altering host or pathogen rhythms through methods such as overexpression, gene silencing/knockout (KO) or rhythm inversion can impact pathogen activities (illustrated by mRNA level and viral load; natural rhythm and its impacts in grey, perturbations and consequences in red). (d) Circadian (mis)alignment: differences in circadian alignment between pathogen and recipient hosts can reveal characteristics of pathogen rhythms and their consequences.
Visualization of rhythms.
Figure 3.
Visualization of rhythms. Appropriate choice of figures depends on the type of data, how it has been processed and the biological insight being illustrated. Indicating when data are collected from day (light) and night (dark) is usually denoted by white-black bars (a,b,d), or with grey shaded regions to indicate dark (d–f). It is good practice to include raw data (a) and this format aids comparison of the phase and amplitude of different groups, but for visualizing many groups, a heatmap is useful (b) although while rhythmicity per se is visible, resolution of phase and amplitude may be reduced. The intensity and amplitude of measurements from cell-reporters can decay over time, requiring detrending and normalizing to deconvolve the biological rhythm of interest from other shorter- and/or longer-term trends (c). When data are from higher resolution time series than in (a), the raw traces are often illustrated to give an indication of noise in the dataset (d). Behaviour data are commonly plotted as an actogram (e), where each row is a different day (i.e. circadian cycle) and double plotting allows each cycle to be compared with the next, with the height of bars indicating activity level. Actograms are particularly useful for illustrating the effects of perturbating an environmental rhythm, which is indicated by moving the white and grey shading between rows (here, a phase shift of 6 h which advances the rhythm is illustrated). Data illustrated in (c–e) represent continuous or repeated measures on an individual independent replicate (e.g. a single organism or culture) and can confer higher temporal resolution, less variance and more power to analyses than data represented in (a,b), which are often derived from destructive sampling so that each time point represents different replicates. Polar or Rayleigh plots (f) are particularly good for visualizing phase because the cyclical nature is clear. In addition to displaying the rhythm and its characteristics, it is good practice to give an indication of the strength of support for the rhythm, so periodograms (g) are often included in electronic supplementary figures.

Similar articles

References

    1. Wright HK. 1901. The malarial fevers of british malaya. Singapore, China: Kelly & Walsh. See https://archive.org/details/b29000841/page/n3/mode/2up.
    1. Stangherlin A, et al. . 2021. Compensatory ion transport buffers daily protein rhythms to regulate osmotic balance and cellular physiology. Nat. Commun. 12, 6035. (10.1038/s41467-021-25942-4) - DOI - PMC - PubMed
    1. Wong DCS, et al. . 2022. CRYPTOCHROMES promote daily protein homeostasis. EMBO J. 41, e108883. (10.15252/embj.2021108883) - DOI - PMC - PubMed
    1. Wyse C, O’Malley G, Coogan AN, McConkey S, Smith DJ. 2021. Seasonal and daytime variation in multiple immune parameters in humans: evidence from 329,261 participants of the UK biobank cohort. iScience 24, 102255. (10.1016/j.isci.2021.102255) - DOI - PMC - PubMed
    1. Collins EJ, Cervantes-Silva MP, Timmons GA, O’Siorain JR, Curtis AM, Hurley JM. 2021. Post-transcriptional circadian regulation in macrophages organizes temporally distinct immunometabolic states. Genome Res. 31, 171–185. (10.1101/gr.263814.120) - DOI - PMC - PubMed

LinkOut - more resources