

Optimized Time-Segmented Acquisition Expands Peptide and Protein Identification in TIMS-TOF Pro Mass Spectrometry
- PMID: 39842810
- PMCID: PMC11811991
- DOI: 10.1021/acs.jproteome.4c00690
Optimized Time-Segmented Acquisition Expands Peptide and Protein Identification in TIMS-TOF Pro Mass Spectrometry
Abstract
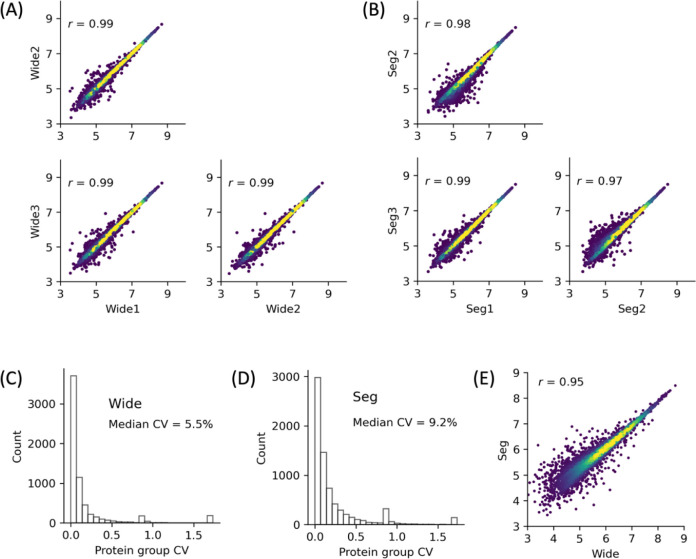
We introduce here a novel approach, termed time-segmented acquisition (Seg), to enhance the identification of peptides and proteins in trapped ion mobility spectrometry (TIMS)-time-of-flight (TOF) mass spectrometry. Our method exploits the positive correlation between ion mobility values and reversed-phase liquid chromatography (LC) retention time to improve ion separation and resolution. By dividing the LC retention time into multiple segments and applying a segment-specific narrower ion mobility range within the TIMS tunnel, we achieved better separation and higher resolution of ion mobility. In comparison to conventional TIMS methods, which typically scan a static ion mobility range (either from 0.6 to 1.6 [Wide] or from 0.85 to 1.3 [Narrow], V × s/cm2), the Seg method demonstrates marked improvements in identification rates. Compared to Wide scanning, the Seg method increases peptide identifications by 17-27% and protein identifications by 6-16% depending on the gradient length and the sample load. The enhancement in peptide identification is even more pronounced when compared to Narrow scanning, with an increase of 34-86%. These findings highlight the potential of the Seg dda-PASEF method in expanding the capabilities of TIMS-TOF mass spectrometry, especially for peptide-focused analyses, such as post-translational modifications and peptidomics.
Keywords: TIMS-TOF; dda-PASEF; ion mobility; label-free quantitation; phosphoproteomics.
Conflict of interest statement
The authors declare no competing financial interest.
Figures


Similar articles
-
Enhancement of Proteome Coverage by Ion Mobility Fractionation Coupled to PASEF on a TIMS-QTOF Instrument.J Proteome Res. 2022 Aug 5;21(8):2036-2044. doi: 10.1021/acs.jproteome.2c00336. Epub 2022 Jul 24. J Proteome Res. 2022. PMID: 35876248 Free PMC article.
-
Trapped Ion Mobility Spectrometry and Parallel Accumulation-Serial Fragmentation in Proteomics.Mol Cell Proteomics. 2021;20:100138. doi: 10.1016/j.mcpro.2021.100138. Epub 2021 Aug 17. Mol Cell Proteomics. 2021. PMID: 34416385 Free PMC article. Review.
-
Online Parallel Accumulation-Serial Fragmentation (PASEF) with a Novel Trapped Ion Mobility Mass Spectrometer.Mol Cell Proteomics. 2018 Dec;17(12):2534-2545. doi: 10.1074/mcp.TIR118.000900. Epub 2018 Nov 1. Mol Cell Proteomics. 2018. PMID: 30385480 Free PMC article.
-
Bottom-up Histone Post-translational Modification Analysis using Liquid Chromatography, Trapped Ion Mobility Spectrometry, and Tandem Mass Spectrometry.J Proteome Res. 2024 Sep 6;23(9):3867-3876. doi: 10.1021/acs.jproteome.4c00177. Epub 2024 Aug 23. J Proteome Res. 2024. PMID: 39177337
-
Eleven shades of PASEF.Expert Rev Proteomics. 2024 Sep-Oct;21(9-10):367-376. doi: 10.1080/14789450.2024.2413092. Epub 2024 Oct 24. Expert Rev Proteomics. 2024. PMID: 39435569 Review.
Cited by
-
Thin-diaPASEF: diaPASEF for maximizing proteome coverage in single-shot proteomics.DNA Res. 2025 Jul 4;32(4):dsaf019. doi: 10.1093/dnares/dsaf019. DNA Res. 2025. PMID: 40704459 Free PMC article.
References
MeSH terms
Substances
LinkOut - more resources
Full Text Sources
