Review
. 2025 Jul;62(1):20-39.
doi: 10.1002/jmri.29712. Epub 2025 Jan 22.

Magnetic Resonance Acoustic Radiation Force Imaging (MR-ARFI)

Affiliations
Review

Magnetic Resonance Acoustic Radiation Force Imaging (MR-ARFI)

Henrik Odéen et al. J Magn Reson Imaging. 2025 Jul.

Abstract

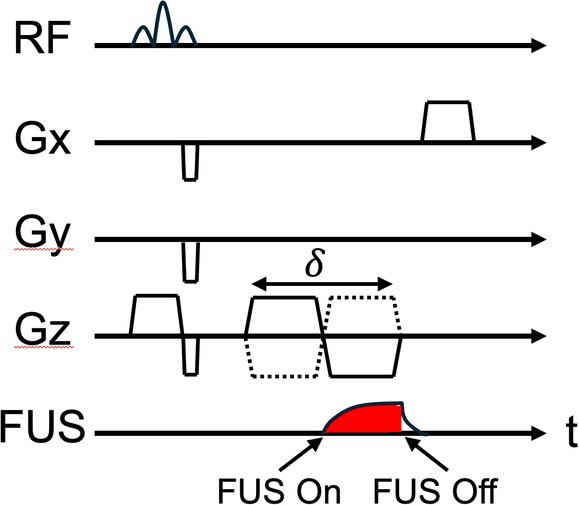
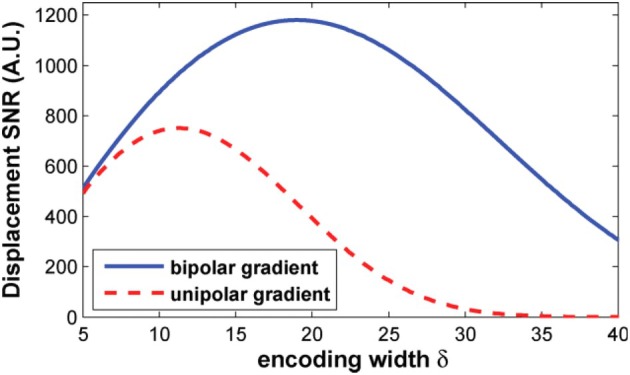
This review covers the theoretical background, pulse sequence considerations, practical implementations, and multitudes of applications of magnetic resonance acoustic radiation force imaging (MR-ARFI) described to date. MR-ARFI is an approach to encode tissue displacement caused by the acoustic radiation force of a focused ultrasound field into the phase of a MR image. The displacement encoding is done with motion encoding gradients (MEG) which have traditionally been added to spin echo-type and gradient recalled echo-type pulse sequences. Many different types of MEG (monopolar, bipolar, tripolar etc.) have been described and pros and cons are discussed. We further review studies investigating the safety of MR-ARFI, as well as approaches to simulate the MR-ARFI displacement. Lastly, MR-ARFI applications such as for focal spot localization, tissue stiffness interrogation following thermal ablation, trans-skull aberration correction, and simultaneous MR-ARFI and MR thermometry are discussed. EVIDENCE LEVEL: N/A TECHNICAL EFFICACY: Stage 1.

Keywords: ARFI; MR‐ARFI; acoustic radiation force imaging; focused ultrasound; high intensity focused ultrasound; thermal therapy.


Figures

FIGURE 1
FIGURE 1
Pulse sequence diagram of a line‐scan approach using used a pair of Stejskal–Tanner (mono‐polar lobes) as motion encoding gradients. δ denotes the duration (in msec) of one MEG lobe, and G the gradient amplitude (in mT/m). On the “FUS” axis, the shaded areas indicate when the FUS is applied and the “envelope” indicates the exponential rise and fall of the tissue displacement. (a) McDannold and Maier investigated two approaches, applying the FUS during the first MEG lobe (red shaded area) vs. starting the FUS before the 180° to reach maximum displacement during the second lobe (green shaded area). (b) Chen et al applied a shorter FUS pulse, to minimize tissue heating, during the second MEG lobe (red area) after the 180° pulse. Gx, Gy, and Gz represents the readout (frequency encoding), phase encoding and slice encoding gradient axis, respectively.
FIGURE 2
FIGURE 2
Pulse sequence diagram of a gradient recalled echo (GRE)‐type pulse sequence with bi‐polar gradients inserted between the excitation and readout (Gx). This is the most used MEG approach for GRE pulse sequences. In this case, δ denotes the duration of the bi‐polar gradient pair (i.e., both the positive and the negative lobe). One commonly used approach is to acquire two images with the MEG polarity flipped, as indicated by the dashed line, as this doubles the sensitivity. Instead of the single GRE readout depicted in this schematic, echo planar imaging (EPI) readout modules, both segmented (i.e., multi‐shot) and single‐shot, are routinely used to speed up acquisitions.
FIGURE 3
FIGURE 3
Pulse sequence diagram of two different types of interleaving in GRE pulse sequences, both with segmented EPI read‐outs. (a) de Bever et al interleaved acquisition of FUS‐ON and FUS‐OFF images on the TR level. (b) Mougneot et al interleaved on the acquisition level and applied the FUS to first the second MEG lobe (odd images) and then the first MEG lobe (even images). To get more accurate displacements a “MEG delay” had to be inserted between the two lobes in the MEG pair. In both these approaches both the tissue displacement and MR thermometry can be simultaneously calculated.
FIGURE 4
FIGURE 4
Pulse sequence diagram of two different types of bi‐polar gradients often used in spin echo (SE)‐type pulse sequences. (a) In “Repeated” bi‐polar‐type acquisitions the same polarity MEG is played before and after the 180° re‐focusing pulse, (b) whereas in “Interleaved” bi‐polar‐type acquisitions the MEG polarity is flipped after the 180° pulse. Both Chen et al and Kaye and Butts Pauly compared the two approaches and showed that repeated bi‐polar MEGs have the most stable background phase due to less eddy currents.
FIGURE 5
FIGURE 5
Simulation of displacement SNR as a function of MEG duration for monopolar (unipolar) and bipolar gradients in spin echo‐type pulse sequences using Eq. 13. This simulation assumed brain white matter tissue using apparent diffusion coefficient of 1.5 × 103 mm2/s and T 2 of 92 msec. It can be seen that initially longer MEG duration increases the phase sensitivity, but eventually the SNR loss with higher b‐values results in decreased phase sensitivity. Bi‐polar gradients is in this case shown to be more sensitive than monopolar. With the given values bipolar has an optimal duration of ~19 msec and monopolar an optimal duration of ~12 msec. Adapted from Fig. 7 of Chen J, Watkins R, Pauly KB. Optimization of encoding gradients for MR‐ARFI. Magn Reson Med 2010;63(4):1050‐1058. Reprinted with permission.
FIGURE 6
FIGURE 6
Experimental demonstration of maximizing measured displacement by adjusting time shift (TS) between MEG and FUS. (a) Pulse sequence diagram showing the TS variable as implemented in a GRE‐type pulse sequence. Negative TS means FUS starts before the second MEG lobe, and positive TS means FUS starts after the start of the second MEG lobe. (b) Experimental results from Auboiroux et al showing increased equivalent averaged displacement in ex vivo liver as the TS varies from −5 to 0 msec. The displacement sensitivity can be seen to be twice as high for a TS of −2.5 msec (i.e., FUS starts before MEG) compared to TS of 0 msec (i.e., FUS and MEG start at the same time). Adapted from Fig. 5 of Viallon VAM, Roland J, Hyacinthe J‐N, Petrusca L, Morel DR, Goget T, Terraz S, Gross P, Becker CD, Salomir R. ARFI‐prepared MRgHIFU in liver: Simultaneous mapping of ARFI‐displacement and temperature elevation, using a fast GRE‐EPI sequence. Magn Reson Med 2012;68(3):932‐946. Reprinted with permission.
FIGURE 7
FIGURE 7
Method described by Kaye and Butts Pauly to find the tissue response time (rise and fall times). (a) Pulse sequence diagram showing a spin echo pulse sequences with two short, 1 msec long, monopolar MEGs on either side of the 180° pulse. A pause was inserted between the 180° pulse and the MEG so that the 9.5 msec long FUS pulse could be shifted across the MEG from −5 to +20 msec. (b) Example of phase image where the dotted line indicates the location plotted for all different offsets between the gradients and FUS (−5 to +20 msec) to the right. The maximum can be seen to occur around 9.5 msec, which is the length of the FUS pulse. (c) The full‐width‐at‐half maximum increases linearly with time at a rate of 0.35 msec/s, indicating the creation and propagation of a shear wave from the FUS focus. (d) By plotting displacement as a function of MEG‐FUS offset the exponential functions in Eqs. 2 and 3 can be fitted to extract the rise and fall times, which in this case were estimated to be 5.97 and 5.94 msec, respectively. Adapted from Fig. 7 of Kaye EA, Pauly KB. Adapting MRI acoustic radiation force imaging for in vivo human brain focused ultrasound applications. Magn Reson Med 2013;69(3):724‐733. Reprinted with permission.
FIGURE 8
FIGURE 8
Example data from a fast 2D single‐shot (SS) GRE EPI approach using bi‐polar MEGs (Fig. 2). Top row shows experiment in ex vivo porcine muscle and bottom row shows in vivo porcine liver. (a) and (c) Temperature (top row) and displacement (bottom row) maps (simultaneously acquired) at the beginning and end of ablation, and (b) and (d) temperature and displacement progression during 2 minutes (ex vivo muscle) and 30 seconds (in vivo liver) heatings. The high sampling rate achieved with SS EPI and GRAPPA (R = 2) can be seen in (b) and (d). In the ex vivo experiment three slices were interleaved with a TR of 266 msec (each slice updated every 3 × 266 = 798 msec) and in the in vivo experiment three slices were interleaved with a TR of 333 msec (each slice updated every 3 × 333 = 999 msec). Adapted from Fig. 4 of Bour P, Marquet F, Ozenne V, Toupin S, Dumont E, Aubry J‐F, Lepetit‐Coiffe M, Quesson B. Real‐time monitoring of tissue displacement and temperature changes during MR‐guided high intensity focused ultrasound. Magn Reson Med 2017;78(5):1911‐1921. Reprinted with permission.
FIGURE 9
FIGURE 9
Example of simultaneous MR‐ARFI and MRT in ex vivo turkey muscle using a segmented EPI GRE pulse sequence with bi‐polar gradients. (a) Phase evolution of MR image during 60 seconds. Note the “flipping phase” artifact during the baseline measurements, due to eddy currents from alternating MEG polarity. (b) Same data as in (a) after “double reference” have been applied to remove the eddy current‐induced phase variations. Processing data in (b) according to Eqs. 14 and 15 results in displacement in (c) and temperature in (d). Note the halved temporal resolution in (c) and (d) compared to (a) and (b) due to the two‐phase measurements in Eqs. 14 and 15. (e) Time series of displacement (top row) and temperature change (bottom row) maps, with same time axis as in (a)–(d). Displacement is seen to return to 0 when FUS is turned off (at 45 seconds), but temperature is still cooling off even after the FUS is turned off. Adapted from Fig. 3 of Viallon VAM, Roland J, Hyacinthe J‐N, Petrusca L, Morel DR, Goget T, Terraz S, Gross P, Becker CD, Salomir R. ARFI‐prepared MRgHIFU in liver: Simultaneous mapping of ARFI‐displacement and temperature elevation, using a fast GRE‐EPI sequence. Magn Reson Med 2012;68(3):932‐946. Reprinted with permission.
FIGURE 10
FIGURE 10
Example of simultaneous MR‐ARFI and MRT in a SE‐based pulse sequence with repeated bi‐polar gradients. (a) Pulse sequence diagram where a GRE‐echo readout, green gradient lobes, has been added to a standard 2D SE pulse sequence, to acquire data for PRF shift thermometry. (b) (Top) Displacement and temperature maps (assuming 37°C starting temperature) for increasing acoustic power of 37 to 181 W. (Bottom) As expected both displacement (left) and temperature (right) increase linearly with applied acoustic power (linear fits had r = 0.99 in both cases). Adapted from Fig. 9 of Kaye EA, Pauly KB. Adapting MRI acoustic radiation force imaging for in vivo human brain focused ultrasound applications. Magn Reson Med 2013;69(3):724‐733. Reprinted with permission.
FIGURE 11
FIGURE 11
Example of MR‐ARFI applied in vivo during a breast FUS ablation procedure. Simultaneous MR‐ARFI and MRT was performed using the method described by de Bever et al (Fig. 3a). (a) Temperature maps (assuming 37°C starting temperature) overlaid on post treatment contrast enhanced T 1‐weighted image. Temperature measurements are performed using the PRF shift method and hence only available in the fibroglandular tissue. (b) MR‐ARFI showing the entire focal spot in both fibroglandular and adipose tissues, highlighting the usefulness of MR‐ARFI in highly‐adipose tissued where MRT can be insufficient. (c) Cumulative thermal dose, which is based on the MRT, is hence also only available in the fibroglandular tissue, however enhancement in the near‐field from the ablation can be observed as contrast enhancement in the underlaying T 1‐weighted image, as predicted by the MR‐ARFI. Adapted from Fig. 9 of Payne A, Merrill R, Minalga E, Hadley JR, Odéen H, Hofstetter LW, Johnson S, de Lara CT, Auriol S, Recco S, Dumont E, Parker DL, Palussiere J. A breast‐specific MR guided focused ultrasound platform and treatment protocol: First‐in‐human technical evaluation. IEEE Trans Biomed Eng 2021;68(3):893‐904. Reprinted with permission.
FIGURE 12
FIGURE 12
Example of results of transcranial phase aberration correction using the method of Hertzberg et al. (a) Phase aberration correction was performed through a human cadaver skull and was shown to result in higher focal spot pressures than the clinically used CT‐based correction as seen in (a) displacement maps and (b) line plots through the focus. Adapted from Figs. 7 and 8 of Hertzberg Y, Volovick A, Zur Y, Medan Y, Vitek S, Navon G. Ultrasound focusing using magnetic resonance acoustic radiation force imaging: Application to ultrasound transcranial therapy. Med Phys 2010;37(6):2934‐2942. Reprinted with permission.
FIGURE 13
FIGURE 13
Tissue displacement decrease after FUS ablation in human cadaver breast. Tissue displacement (a) before and (b) after FUS ablation in 18 locations in a human cadaver breast. (c) Mean ± SD of line plot through the 18 sonications showing severely decreased peak displacement increased shear wave velocity (measured as Δd). Adapted from Figs. 6 and 7 of Bitton RR, Kaye E, Dirbas FM, Daniel BL, Pauly KB. Toward MR‐guided high intensity focused ultrasound for presurgical localization: Focused ultrasound lesions in cadaveric breast tissue. J Magn Reson Imaging 2012;35(5):1089‐1097. Reprinted with permission.
FIGURE 14
FIGURE 14
Simulation and experimental validation of MR‐ARFI displacement maps, using the method described by Payne et al. (a) and (d) Show two orthogonal views of experimental displacement maps, with corresponding simulated displacements in (b) and (e), in 125 bloom gelatin phantom. The difference between experimentally measured and simulated maps are shown in (c) and (f) (note the difference in scales). (g) Shows experimental (sloid lines) and simulated (dashed lines) line plots through the focal spot in phantoms of various stiffness (higher bloom = stiffer), with stiffer phantoms having less displacement for a given FUS intensity. Adapted from Figs. 6 and 7 of Payne A, de Bever J, Farrer A, Coats B, Parker DL, Christensen DA. A simulation technique for 3D MR‐guided acoustic radiation force imaging. Med Phys 2015;42(2):674‐684. Reprinted with permission.

Similar articles

References

    1. Nightingale KR, Palmeri ML, Nightingale RW, Trahey GE. On the feasibility of remote palpation using acoustic radiation force. J Acoust Soc Am 2001;110:625‐634. - PubMed
    1. Trahey GE, Palmeri ML, Bentley RC, Nightingale KR. Acoustic radiation force impulse imaging of the mechanical properties of arteries: In vivo and ex vivo results. Ultrasound Med Biol 2004;30:1163‐1171. - PubMed
    1. Ashikuzzaman M, Heroux A, Tang A, Cloutier G, Rivaz H. Displacement tracking techniques in ultrasound elastography: From cross correlation to deep learning. IEEE Trans Ultrason Ferroelectr Freq Control 2024;71:842‐871. - PubMed
    1. Nakano M, Kuromatsu R, Kawaguchi T. Ultrasonographic assessment of tissue stiffness: Recent progress in transient elastography and shear wave elastography in the liver and various organs. Kurume Med J 2024;70(1.2):1‐10. - PubMed
    1. Bercoff J, Muller M, Tanter M, Fink M. Study of viscous and elastic properties of soft tissues using supersonic shear imaging. Proc IEEE Ultrason Symp 2003;1:925‐928.