. 2025 Jan 22;16(1):947.
doi: 10.1038/s41467-025-55898-8.

Myosin-based nucleation of actin filaments contributes to stereocilia development critical for hearing

Affiliations

Myosin-based nucleation of actin filaments contributes to stereocilia development critical for hearing

Zane G Moreland et al. Nat Commun. .

Abstract

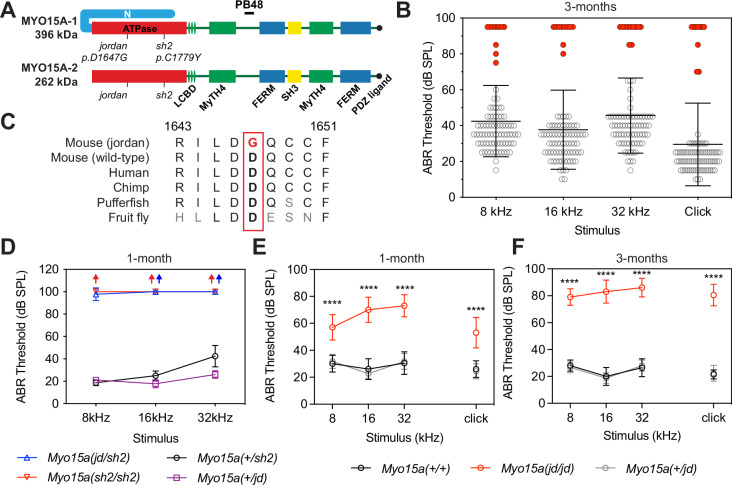
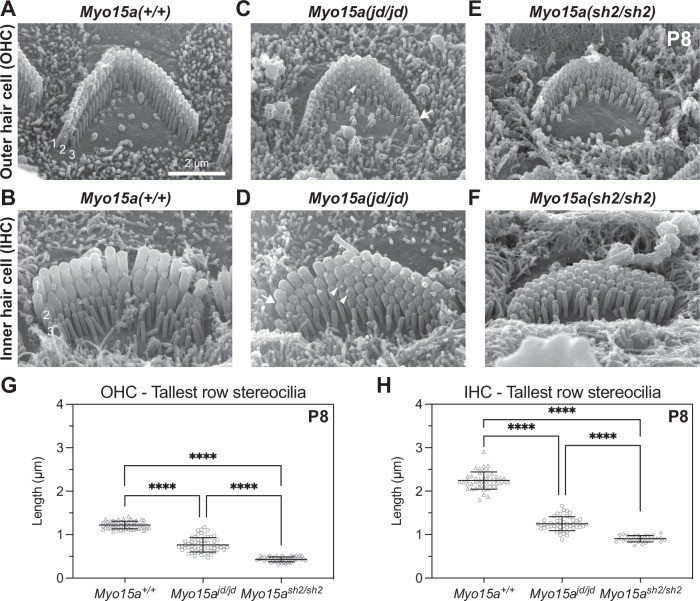
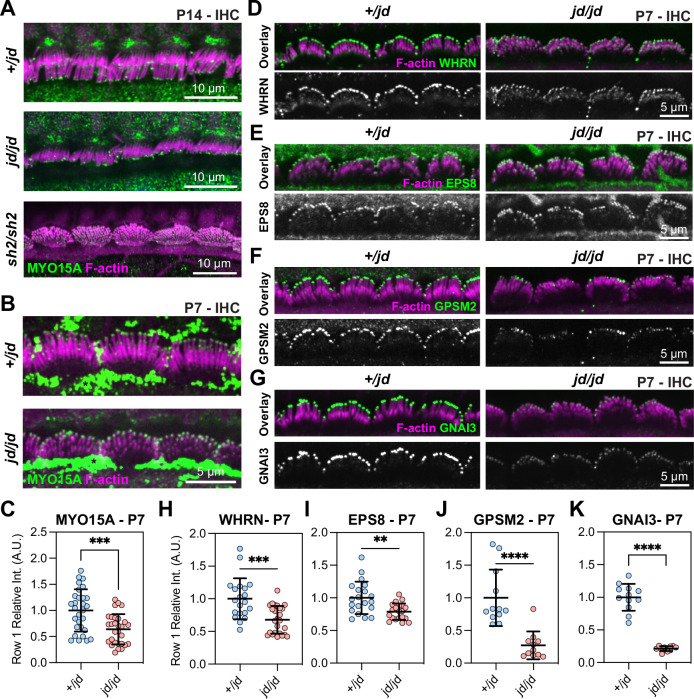
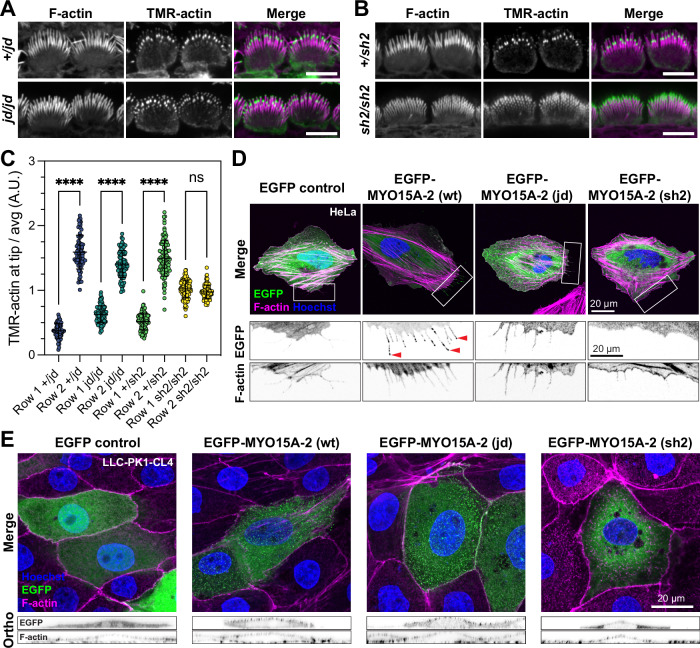
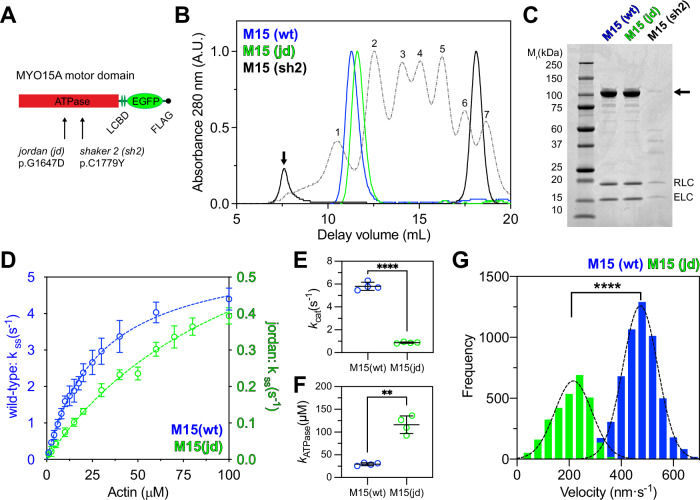
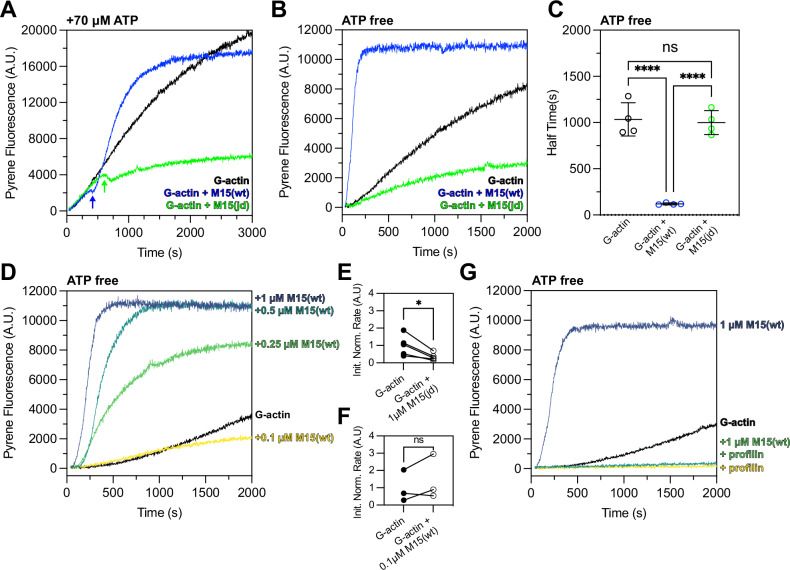
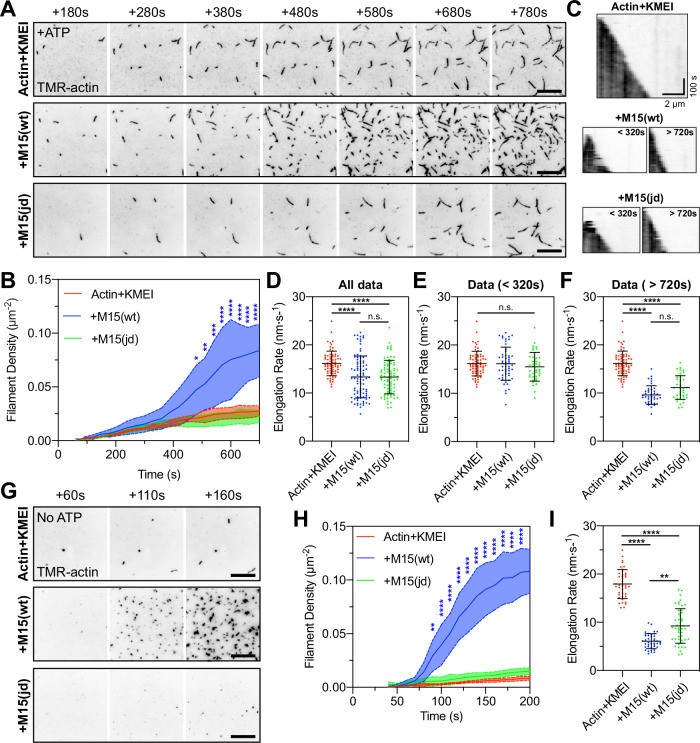
Assembly of actin-based stereocilia is critical for cochlear hair cells to detect sound. To tune their mechanosensivity, stereocilia form bundles composed of graded rows of ascending height, necessitating the precise control of actin polymerization. Myosin 15 (MYO15A) drives hair bundle development by delivering critical proteins to growing stereocilia that regulate actin polymerization via an unknown mechanism. Here, we show that MYO15A is itself an actin nucleation-promoting factor. Moreover, a deafness-causing mutation in the MYO15A actin-binding interface inhibits nucleation activity but still preserves some movement on filaments in vitro and partial trafficking on stereocilia in vivo. Stereocilia fail to elongate correctly in this mutant mouse, providing evidence that MYO15A-driven actin nucleation contributes to hair bundle biogenesis. Our work shows that in addition to generating force and motility, the ATPase domain of MYO15A can directly regulate actin polymerization and that disrupting this activity can promote cytoskeletal disease, such as hearing loss.


Conflict of interest statement

Competing interests: The authors declare no competing interests.

Figures

Fig. 1
Fig. 1. The jordan mutation causes progressive hearing loss in a mouse model of DFNB3.
A Schematic showing the protein domains of the long (MYO15A-1) and short (MYO15A-2) isoforms encoded by the Myo15a gene. The jordan and shaker-2 deafness mutations are shown. B ABR phenotyping of the jordan pedigree at 3 months identified 10 mice with statistically-elevated hearing thresholds (red circles) for click and at 8, 16, and 32 kHz stimuli, compared to their normal hearing pedigree mates (n = 73 mice, black circles). Statistical outliers were detected using robust regression and outlier removal (red circles, ROUT, Q = 1%). Thresholds of affected mice that did not respond to the highest intensity stimulus (90 dB SPL) are recorded as 95 dB SPL. C Evolutionary conservation of the aspartate (D) residue of MYO15A altered to glycine (G) in jordan mice that causes hearing loss. Residue positions refer to mouse MYO15A-1 (NP_034992.2). D ABR recordings of Myo15ajd/sh2 (n = 7 mice) compound heterozygotes at P28 shows profound hearing loss, similar to Myo15ash2/sh2 (n = 4), with thresholds elevated compared with normal hearing Myo15a+/jd (n = 9) or Myo15a+/sh2 littermates (n = 4). Arrows indicate no response. E, F Longitudinal auditory phenotyping of jordan mice at 1- (E) and 3- (F) months of age. ABR recordings show that Myo15a jd/jd mice (red, n = 10 mice) exhibit a progressive, moderate-to-severe hearing loss affecting all frequencies, whereas age-matched Myo15a+/+ (black, n = 10) and Myo15a+/jd (grey, n = 15) littermate controls have normal thresholds (15–45 dB SPL). Myo15a+/+ vs Myo15ajd/jd comparison, ****, P < 0.0001, ANOVA with Tukey’s multiple comparisons test. Data are mean ± SD.
Fig. 2
Fig. 2. Stereocilia growth is disrupted in jordan mutant hair cells.
A–F Representative SEM images of stereocilia bundles from Myo15a+/+, Myo15ajd/jd, and Myo15ash2/sh2 OHCs (A, C, E) and IHCs (B, D, F) at P8. In Myo15a +/+ mice, both IHC and OHC bundles display the characteristic staircase architecture with 3 stereocilia ranks of increasing height (labeled in white font). IHC and OHC bundles from either Myo15ajd/jd and Myo15ash2/sh2 mice are shorter in height than the wild-type bundles. Myo15ajd/jd stereocilia taper in height towards the periphery of the bundle (arrow), and additional stereocilia rows are visible (arrow head). Myo15ash2/sh2 hair cells also have additional stereocilia rows, but they lack graded thickness and height. G Projected heights of tallest (row 1) OHC stereocilia at P8 are 1.2 ± 0.1 µm (Myo15a+/+, 58 stereocilia from 4 mice), 0.8 ± 0.1 µm (Myo15ajd/jd, 60 stereocilia from 4 mice), and 0.4 ± 0.1 µm (Myo15ash2/sh2, 50 stereocilia from 2 mice). H Projected heights of tallest (row 1) IHC stereocilia at P8 are 2.2 ± 0.2 µm (Myo15a+/+, 47 stereocilia from 4 mice), 1.3 ± 0.1 µm (Myo15ajd/jd, 47 stereocilia from 4 mice), and 0.9 ± 0.1 µm (Myo15ash2/sh2, 30 stereocilia from 2 mice). ****, P < 0.0001, Brown–Forsythe and Welch ANOVA with Dunnett’s T3 multiple comparisons test. Representative images are from mid-cochlear turn. Data are mean ± SD. Scale bar, 2 µm.
Fig. 3
Fig. 3. Trafficking of MYO15A and elongation complex in jordan hair cells.
A, B Immunofluorescence (IF) confocal images showing anti-MYO15A (green, PB48) in control Myo15a+/jd, Myo15ash2/sh2, and Myo15ajd/jd IHCs fixed at P14 (A), and Myo15a+/jd and Myo15ajd/jd IHCs at P7 (B). Phalloidin was used to label F-actin (magenta). Strong extra-cellular PB48 labelling was observed independent of genotype at P7 and thought to be artefactual (asterisk). C Quantification of MYO15A antibody (PB48) at the tips of row 1 stereocilia in P7 IHCs. N = 29 hair bundles (+/jd) and n = 29 hair bundles (jd/jd). Three independent mice were quantified per condition. DG IF confocal images of elongation complex proteins (green) WHRN (D), EPS8 (E), GPSM2 (F) and GNAI3 (G) in control Myo15a+/jd and Myo15ajd/jd IHCs fixed at P7, overlaid with phalloidin labelled F-actin (magenta). HK P7 quantification of IF labelling at row 1 stereocilia tips for WHRN (+/jd: n = 20, jd/jd: n = 25) hair bundles (H), EPS8 (+/jd: n = 20, jd/jd: n = 20) hair bundles (I), GPSM2 (+/jd: n = 12, jd/jd: n = 11) hair bundles (J) and GNAI3 (+/jd: n = 12, jd/jd: n = 12) hair bundles (K). Two (GPSM2 + GNAI3) and three (WHRN + EPS8) independent mice quantified per condition. Images are representative of data from at least two independent animals per genotype / antibody. Images comparing antibody labelling between +/jd and jd/jd genotypes are mapped equally. Data are mean ± SD, ****, P < 0.0001, ***, P < 0.001, **, P < 0.01, computed using a Mann-Whitney U-test.
Fig. 4
Fig. 4. The jordan mutation does not disrupt barbed-end capping in stereocilia, but does alter MYO15A trafficking on cellular actin filaments.
A, B Actin barbed-end assay in detergent-permeabilized inner hair cells from mouse cochlear explants acutely isolated at P7. TMR-labelled G-actin (green) was added prior to fixation to identify uncapped barbed ends. Phalloidin labelling of F-actin (magenta) is overlaid. In both Myo15ajd/jd and littermate Myo15a+/jd controls, barbed-ends were detected at row 2 stereocilia tips, and at the tips of all stereocilia rows in Myo15ash2/sh2 hair cells. C Quantification of TMR-barbed end incorporation in row 1 and 2 stereocilia (from left to right columns, n = 75, 81, 98, 90, 102, 99, 119, 102 stereocilia respectively, 9 hair cells from 3 independent mice per genotype), ****, P < 0.0001, one-way ANOVA with Šídák’s multiple comparisons test. D HeLa cells were transfected with EGFP-tagged Myo15a-2 expression constructs or EGFP alone (green) as indicated, fixed and probed with phalloidin (magenta) and Hoechst (blue). Wild-type protein trafficked to filopodia tips (red arrowheads), while jordan and shaker-2 mutants did not. Boxed regions are magnified (inverted grayscale). E LLC-PK1-CL4 cells were transfected with EGFP-tagged Myo15a-2 (green), fixed and labelled with phalloidin (magenta) and Hoechst (blue). The jordan mutant concentrated at microvillar tips, similar to wild-type, whereas the shaker-2 mutant did not. Orthogonal projections are shown (inverted grayscale). Images are representative from at least three independent experiments. Data are mean ± SD. Scale bars, 5 µm (A, B); 20 µm (D, E).
Fig. 5
Fig. 5. The jordan MYO15A motor domain is enzymatically and mechanically active.
A Cartoon of truncated MYO15A minimal motor domains expressed in Sf9 cells, consisting of the ATPase and two light-chain binding domains (LCBD) that bind to ELC and RLC light chains. Residue positions refer to mouse MYO15A-1 (NP_034992.2). B Size exclusion chromatography (SEC) analysis of FLAG/IEX purified M15-wt and M15-jd, and of FLAG purified M15-sh2 proteins. Protein calibration standards are shown for comparison (dotted lines); (1) thyroglobulin, (2) ferritin, (3) aldolase, (4) conalbumin, (5) ovalbumin, (6) carbonic anhydrase, (7) ribonuclease A. FLAG purified M15(sh2) was heavily aggregated and analyzed directly by SEC (black line). M15(sh2) eluted close to the void volume (arrow) separate from the FLAG peptide (asterisk). C SDS-PAGE analysis of SEC purified motor domain proteins. The motor domain (arrow) co-purifies with RLC and ELC light chains for all variants. M15-sh2 was misfolded and extracted from Sf9 cells at low yield. D Steady-state ATPase activation of M15-wt and M15-jd motor domains measured using a NADH-coupled assay at 20 ± 0.1 °C. Reactions were performed with [F-actin] as shown. Rectangular hyperbolic fits to averaged data are shown for M15-wt (blue, kcat = 5.8 ± 0.2 s−1, kATPase = 29.1 ± 2.1 μM, mean ± S.E.M, n = 4 experimental determinations) and for M15-jd (green, kcat = 0.87 ± 0.04 s−1, kATPase = 114.3 ± 8.2 μM, mean ± S.E.M, n = 4 experimental determinations). Data points are mean ± SD. E, F Summary of kcat (E) and kATPase (F) parameters for M15-wt (blue, n = 4) and M15-jd (green, n = 4). ****, P < 0.0001, **, P < 0.01, unpaired t-test with Welch’s correction. Data points are mean ± SD and from individual experiments in (D). G Frequency histogram of F-actin velocities in a gliding filament assay at 30 ± 0.1 °C. Gaussian fits (dotted line) are overlaid for M15-wt (473 ± 67 nm⋅s−1, n = 5449 filaments, mean ± SD) and M15-jd (216 ± 71 nm⋅s−1, n = 2844 filaments). ****, P < 0.0001, unpaired t-test with Welch’s correction. All data are from 2 independent protein preparations.
Fig. 6
Fig. 6. The MYO15A motor domain accelerates actin polymerization in a nucleotide-sensitive manner.
A Time-course of 2 µM G-actin (10% pyrene labelled) measured in a fluorimeter with polymerization induced by 1× KMEI (50 mM KCl, 1 mM MgCl2, 1 mM EGTA, 10 mM imidazole, pH 7.0) at t = 0 s (black trace). Addition of either 1 µM M15-wt (blue) or 1 µM M15-jd (green) to the reaction at t = 0 s is shown overlaid. M15-wt stimulates polymerization following an inflection point (blue arrow) where free ATP is exhausted. M15-jd does not stimulate polymerization and is instead inhibitory (green arrow). All reactions contain ~70 µM free ATP carried over from the actin storage G-buffer. B Experiments from (A) repeated using desalted G-actin(ATP) to remove free ATP enforces the strongly bound myosin rigor state. M15-wt immediately increases the rate of actin polymerization (blue), whilst M15-jd does not (green). C Quantification of time to reach half-maximal pyrene fluorescence from data in (B) (n = 4 experimental determinations). Data are mean ± SD. ****,  P < 0.0001, one-way ANOVA with Tukey’s multiple comparisons test. D Dose-response of M15-wt (0.1–1 µM) upon polymerization of 2 µM desalted G-actin (ATP) induced by KMEI at t = 0 s. E, F Analysis of initial polymerization rates of either 1 µM M15-jd + G-actin (data from B, n = 5), or 0.1 µM M15-wt + G-actin (data from D, n = 3), relative to G-actin polymerizing alone. Paired data points are shown with matched G-actin controls measured on the same day. *, P < 0.05, paired t-test. G Profilin inhibits polymerization of desalted G-actin(ATP) stimulated by M15-wt. Reactions were performed as 2 µM G-actin + KMEI (black trace), 2 µM G-actin + 8 µM profilin + KMEI (yellow trace), 2 µM G-actin + 1 µM M15-wt + KMEI (azure trace), 2 µM G-actin + 8 µM profilin + 1 µM M15-wt + KMEI (green trace). All measurements performed at 25 ± 0.1 °C, and are representative of at least 3 experiments, from 2 independent protein preparations.
Fig. 7
Fig. 7. The MYO15A motor domain nucleates actin filaments de novo.
A TIRFM visualization of actin filaments polymerizing on PEG-biotin-NeutrAvidin functionalized cover glass. Polymerization of 1 µM G-actin (20% TMR + 10% biotin labelled) was induced by KMEI (50 mM KCl, 1 mM MgCl2, 1 mM EGTA, 10 mM imidazole, pH 7.0) at t = 0 s, in the presence of 25 µM ATP. Representative time-lapses shown for: 1 µM G-actin (top), 1 µM G-actin + 1 µM M15(wt) (middle), and 1 µM G-actin + 1 µM mutant M15(jd) (bottom). B Quantification of actin filament density shows delayed nucleation activity of MYO15A in the presence of ATP. n = 3 independent determinations. C Kymographs of actin filament elongation. D Barbed-end elongation rates for G-actin + KMEI (red, n = 69 filaments), G-actin + M15(wt) (blue, n = 94), G-actin + M15(jd) (green, n = 80). E Elongation rate data (from D) re-binned before nucleation, G-actin alone (n = 69 filaments), G-actin + M15(wt) (n = 54), G-actin + M15(jd) (n = 40). F Elongation rate data (from D) re-binned after nucleation, G-actin alone (n = 69 filaments), G-actin + M15(wt) (n = 40), G-actin + M15(jd) (n = 40). The G-actin + KMEI control data set (from D) is reproduced identically as a comparator in (E, F). G Time-lapse of actin filament polymerization induced by KMEI at t = 0 s, with no ATP in solution. G-actin (ATP) monomers were prepared by desalting into ATP-free G-buffer. H Actin filament density shows nucleation activity of MYO15A is accelerated in the absence of ATP. G-actin + KMEI (n = 4 determinations), G-actin + M15(wt) (n = 5), G-actin + M15(jd) (n = 5). I Barbed-end filament rates in the absence of free ATP. Reaction deadtimes were typically 50 s and included in quantification. TIRFM images are shown as inverted grayscale. G-actin + KMEI (n = 40 filaments), G-actin + M15(wt) (n = 40), G-actin + M15(jd) (n = 47). All data are plotted as mean ± SD. Statistics were computed using two-way ANOVA with Dunnett’s multiple comparisons test (B, H), and one-way ANOVA (Kruskal–Wallis) with Dunn’s multiple comparisons test (D, E, F, I). Statistical significance is denoted by ****, P < 0.0001, ***, P < 0.001, **, P < 0.01. Scale bars are 10 µm (A, G). Data are from 3 to 5 experimental determinations (AF), and 4–5 experimental determinations (GI), using 2 independent protein preparations.

Similar articles

Cited by

References

    1. Barr-Gillespie, P.-G. Assembly of hair bundles, an amazing problem for cell biology. Mol. Biol. Cell26, 2727–2732 (2015). - PMC - PubMed
    1. Richardson, G. P., de Monvel, J. B. & Petit, C. How the genetics of deafness illuminates auditory physiology. Annu. Rev. Physiol.73, 311–334 (2011). - PubMed
    1. Vélez-Ortega, A. C. & Frolenkov, G. I. Building and repairing the stereocilia cytoskeleton in mammalian auditory hair cells. Hear. Res.376, 47–57 (2019). - PMC - PubMed
    1. Tilney, L. G., Cotanche, D. A. & Tilney, M. S. Actin filaments, stereocilia and hair cells of the bird cochlea. VI. How the number and arrangement of stereocilia are determined. Dev. Camb. Engl.116, 213–226 (1992). - PubMed
    1. Kaltenbach, J. A., Falzarano, P. R. & Simpson, T. H. Postnatal development of the hamster cochlea. II. Growth and differentiation of stereocilia bundles. J. Comp. Neurol.350, 187–198 (1994). - PubMed

LinkOut - more resources