. 2025 Jan 22;16(1):924.
doi: 10.1038/s41467-025-56210-4.

Inflammatory disease progression shapes nanoparticle biomolecular corona-mediated immune activation profiles

Affiliations

Inflammatory disease progression shapes nanoparticle biomolecular corona-mediated immune activation profiles

Jacob R Shaw et al. Nat Commun. .

Abstract

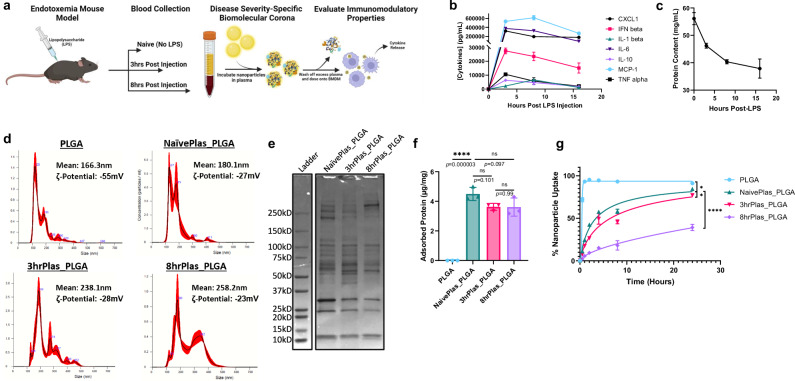
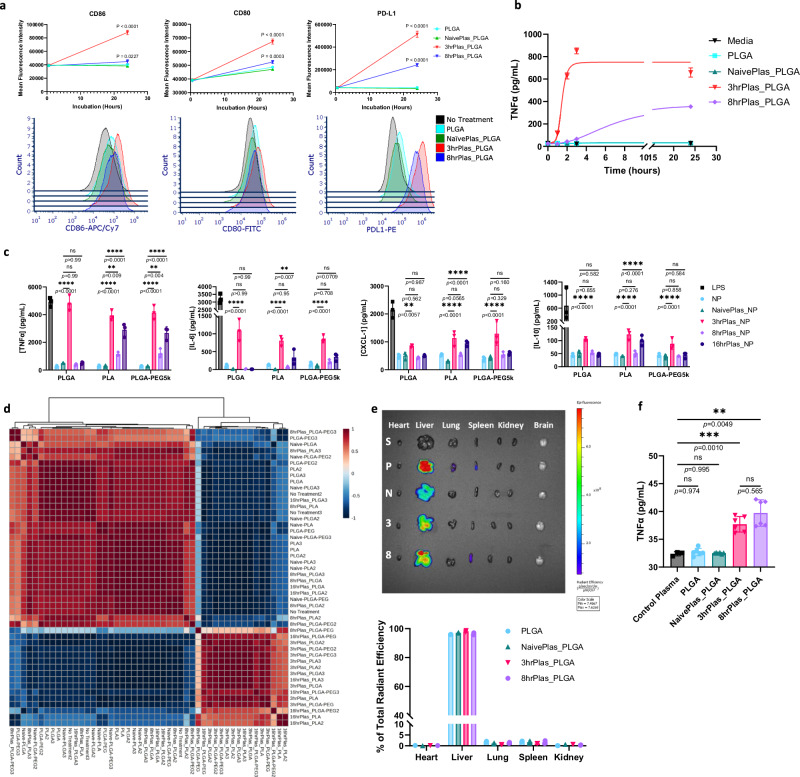
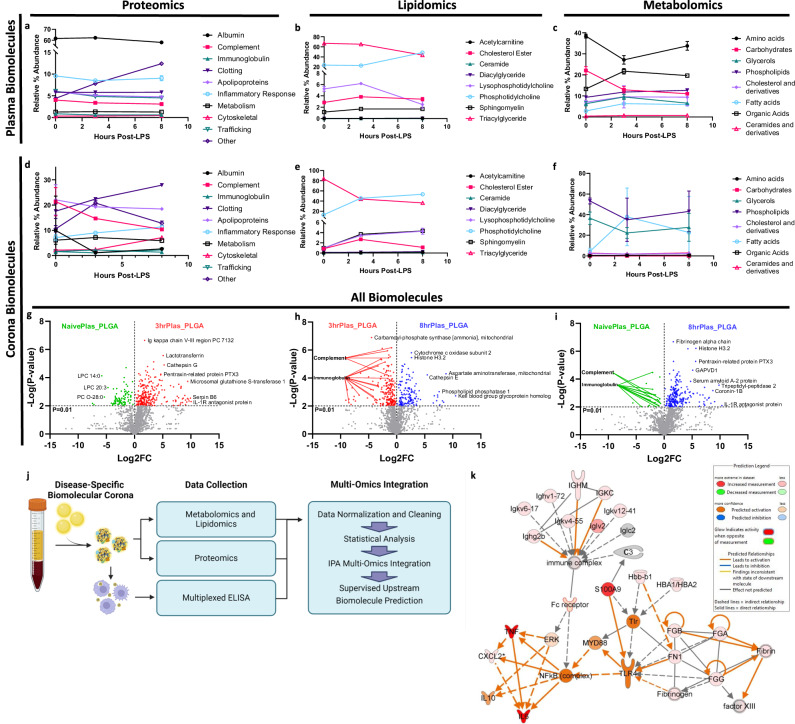
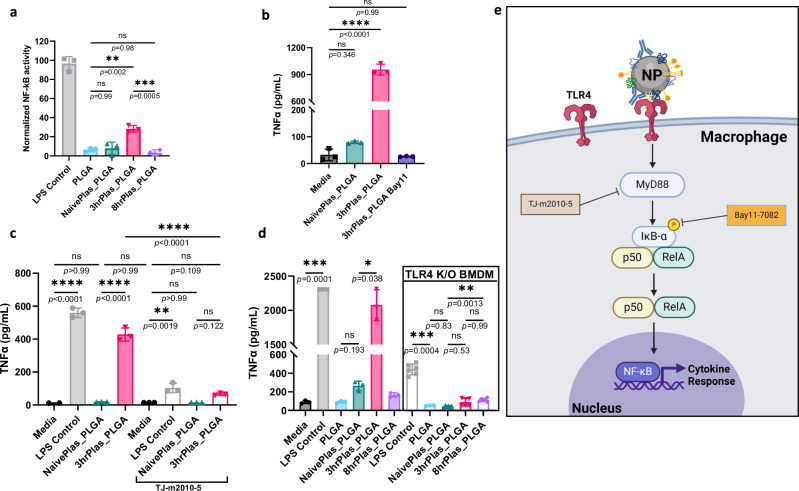
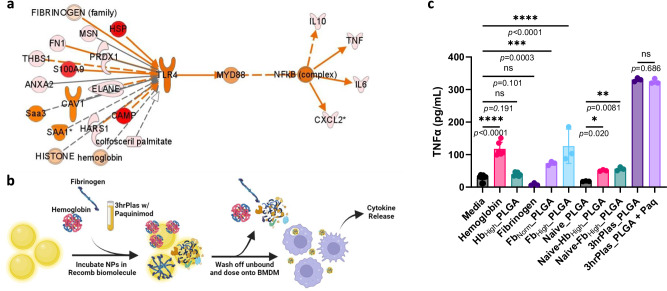
Polymeric nanoparticles (NPs) are promising tools used for immunomodulation and drug delivery in various disease contexts. The interaction between NP surfaces and plasma-resident biomolecules results in the formation of a biomolecular corona, which varies patient-to-patient and as a function of disease state. This study investigates how the progression of acute systemic inflammatory disease influences NP corona compositions and the corresponding effects on innate immune cell interactions, phenotypes, and cytokine responses. NP coronas alter cell associations in a disease-dependent manner, induce differential co-stimulatory and co-inhibitory molecule expression, and influence cytokine release. Integrated multi-omics analysis of proteomics, lipidomics, metabolomics, and cytokine datasets highlight a set of differentially enriched TLR4 ligands that correlate with dynamic NP corona-mediated immune activation. Pharmacological inhibition and genetic knockout studies validate that NP coronas mediate this response through TLR4/MyD88/NF-κB signaling. Our findings illuminate the personalized nature of corona formation under a dynamic inflammatory condition and its impact on NP-mediated immune activation profiles and inflammation, suggesting that disease progression-related alterations in plasma composition can manifest in the corona to cause unintended toxicity and altered therapeutic efficacy.


Conflict of interest statement

Competing interests: The authors declare no competing interests.

Figures

Fig. 1
Fig. 1. Endotoxemia plasma characterization and biomolecular corona translation.
a Schematic representation of the endotoxemia mouse model and plasma extractions for NP corona formation. Plasmas were extracted after varying time-points to assess different inflammation severities (n = 10 mice per timepoint) and used to coat NPs for subsequent macrophage treatments. Created in BioRender. Shaw, J. (2025) https://BioRender.com/s80i128. b Pro-inflammatory cytokine profiles of pooled whole mouse plasma after 0, 3, 8, and 16 h-post LPS injection (representing 3 measurements of n = 10 pooled mouse plasmas per timepoint). c Total protein quantified in whole plasma over time using a bicinchoninic acid (BCA) protein assay (n = 3 biological replicates). d Nanoparticle Tracking Analysis (NTA) of NP corona diameter size distributions after washing off excess plasma. Plots are representative of n = 3 measurements of 30 second recordings. Error bars are represented as red-shaded regions. Mean size and zeta-potential are presented for each condition. e NP corona proteins from NaivePlas, 3hrPlas, and 8hrPlas samples were eluted and run through an SDS-PAGE gel and stained with Coomassie for total protein. f Quantification of proteins eluted from NP coronas using a 3-(4-carboxybenzoyl)quinoline-2-carboxaldehyde (CBQCA) protein assay, represented as ng of protein per mg NP (n = 3 independent replicates). Significance was calculated using a one-way ANOVA with Tukey post hoc test. g Uptake/association kinetic analysis of Cy5.5-labeled PLGA NPs or NP corona-treated macrophages up to 24 h, quantified using flow cytometry (n = 3 biological replicates). Significance was determined in the final 24-hour timepoint using a one-way ANOVA with Tukey’s post-hoc test (PLGA:NaivePlas_PLGA, p = 0.0255; NaivePlas_PLGA:3hrPlas_PLGA, p = 0.0151; NaivePlas_PLGA: 8hrPlas_PLGA, p < 0.00001). All data sets are presented as mean ± S.D. *P < 0.05; **P < 0.01; ***P < 0.001, ****P < 0.0001. ns, not significant (P > 0.05). Source data are provided as a Source Data file.
Fig. 2
Fig. 2. Dynamic immune recognition of NP corona complexes.
a Flow cytometry mean fluorescence intensity (MFI) quantification of macrophage surface markers CD86, CD80, and PD-L1 after treatment with pristine PLGA NPs or NP coronas for 30-min or 24-h (n = 3 biological replicates per timepoint). Representative histograms of 24-hour timepoints are shown below. Data is presented as mean values +/- SD. Statistical significance was determined with a two-way ANOVA using a Dunnett’s test with No Treatment set as control. b TNFα secretions over time from macrophages after PLGA NP or NP corona treatment (n = 3 biological replicates per timepoint). Data is presented as mean values +/- SD. c Multiplex cytokine analysis in the supernatants of NP corona-treated macrophages after 3-hour incubation (n = 3 biological replicates). Data is presented as mean values +/- SD. Statistical significance was determined with a two-way ANOVA using Tukey post hoc test. d Spearman correlation matrix of the macrophage multiplex cytokine analysis. Colors range from dark red, indicating a strong positive correlation between sample cytokines, to dark blue, indicating strong negative correlation. e Organ biodistribution of Cy5.5-labeled PLGA NPs coated in various plasma coronas 3-h post i.v. injection in naïve C57BL/6 mice. Heart, liver, lung, spleen, kidney, and brain were isolated and analyzed via in vivo imaging system (IVIS) for NP fluorescence. Representative organ samples are presented from saline (S), PLGA (P), NaïvePlas_PLGA (N), 3hrPlas_PLGA (3), and 8hrPlas_PLGA (8) treated mice. Percent of total radiant efficiency is presented in the graph below (n = 2 mice per group). No fluorescence was detected in brain samples. f TNFα plasma concentration from NP corona-treated IVIS mice (n = 2 mice per group, 3 technical replicates each). Data is presented as mean +/- SD. Significance was calculated using a two-way ANOVA with Tukey post hoc test. *P < 0.05; **P < 0.01; ***P < 0.001, ****P < 0.0001. ns, not significant (P > 0.05). Source data are provided as a Source Data file.
Fig. 3
Fig. 3. Inflammation severity-associated biomolecule dynamics and corona-induced inflammation prediction.
Bioinformatic quantification of mouse plasma proteins a, lipids b, and metabolites c at varying times after LPS injection (n = 3 measurements of pooled plasma from 10 mice/condition/replicate). Bioinformatic quantification of PLGA NP corona proteins d, lipids e, and metabolites f after plasma incubation (n = 3 biological replicates). Biomolecules are grouped according to function process or structural category and represented as a percent of total biomolecule abundance. All mass spectrometry data is presented as mean values +/- SD. Volcano plot comparing multi-omic biomolecule abundances between NaïvePlas vs. 3hrPlas_PLGA NP coronas g, 3hrPlas vs. 8hrPlas_PLGA NP coronas h, and 8hrPlas vs. NaïvePlas_PLGA NP coronas i Volcano data points are colored green (NaïvePlas), red (3hrPlas), and blue (8hrPlas) based on their elevated plasma condition. Significance was determined for each omics dataset individually using a Two-way ANOVA with Benjamini−Hochberg adjustment. j Schematic representation of multi-omic data processing and Ingenuity Pathway Analysis (IPA) application. Created in BioRender. Shaw, J. (2025) https://BioRender.com/g93r882. k Upstream network effects that were supervised to predict 3hrPlas corona-induced cytokines. Color key and symbols are reported in the legend. Source data are provided as a Source Data file.
Fig. 4
Fig. 4. 3hrPlas coronas signal pro-inflammatory cytokine secretions through TLR4 activation of NF-ĸB.
a. NF-kB activation in RAW-Blue reporter cell line upon incubation with PLGA NP coronas. NF-ĸB activation was normalized to the LPS positive control (n = 3 biologically independent experiments). b TNFɑ secretions from macrophages treated with PLGA NP coronas in the presence or absence of Bay11–7082, an NF-ĸB inhibitor at 10 µM (n = 3 biological replicates), p < 0.0001. c. TNFɑ secretions from macrophages treated with PLGA NP coronas in the presence or absence of TJ-m2010-5, a MyD88 inhibitor at 30 µM (n = 3 biological replicates). d. TNFɑ secretions from macrophages (n = 3 biological replicates) compared to TLR4 knock-out (K/O) macrophages (n = 6 biological replicates) treated with PLGA NP coronas. e. Schematic illustration of the proposed corona-dependent pro-inflammatory cytokine signaling. Created in BioRender. Shaw, J. (2025) https://BioRender.com/v63l645. Data sets are presented as mean ± S.D. Significance for all graphs were calculated using a one-way ANOVA with Tukey’s post-hoc test. *P < 0.05; **P < 0.01; ***P < 0.001, ****P < 0.0001. ns, not significant (P > 0.05). Source data are provided as a Source Data file.
Fig. 5
Fig. 5. TLR4 ligand NP coatings contribute to pro-inflammatory cytokine induction.
a Upstream network prediction further restricted to 3hrPlas-specific corona biomolecules that induce TLR4/MyD88/NF-kB activation. b Schematic representation of recombinant protein pre-coatings to evaluate potential pro-inflammatory biomolecules. Created in BioRender. Shaw, J. (2025) https://BioRender.com/u64r124. c Pro-inflammatory TNFα secretion of macrophages treated with various pre-coated NP coronas. NP coronas evaluated include hemoglobin (20 mg/mL) coatings (HbHigh_PLGA), fibrinogen normal (2 mg/mL) and high (10 mg/mL) (FbNorm_PLGA, FbHigh_PLGA), 3hrPlas_PLGA spiked with Paquinimod S100A9 inhibitor, along with healthy (Naïve) plasma coatings spiked with hemoglobin or fibrinogen. Data sets are presented as mean ± S.D. (Measurements are from n = 3 biological replicates for all samples, with the exception of Media, Hemoglobin, and HbHigh_PLGA which are n = 6). Significance was calculated using a one-way ANOVA with Tukey’s post-hoc test. *P < 0.05; **P < 0.01; ***P <  0.001, ****P < 0.0001. ns, not significant (P > 0.05). Source data are provided as a Source Data file.

Similar articles

Cited by

References

    1. Leong, H. S. et al. On the issue of transparency and reproducibility in nanomedicine. Nat. Nanotechnol.14, 629–635 (2019). - PMC - PubMed
    1. Tenzer, S. et al. Nanoparticle Size Is a Critical Physicochemical Determinant of the Human Blood Plasma Corona: A Comprehensive Quantitative Proteomic Analysis. ACS Nano5, 7155–7167 (2011). - PubMed
    1. Cedervall, T. et al. Understanding the nanoparticle–protein corona using methods to quantify exchange rates and affinities of proteins for nanoparticles. PNAS104, 2050–2055 (2007). - PMC - PubMed
    1. Lundqvist, M. et al. Nanoparticle size and surface properties determine the protein corona with possible implications for biological impacts. Proc. Natl Acad. Sci.105, 14265–14270 (2008). - PMC - PubMed
    1. Monopoli, M. P., Åberg, C., Salvati, A. & Dawson, K. A. Biomolecular coronas provide the biological identity of nanosized materials. Nat. Nanotech7, 779–786 (2012). - PubMed

MeSH terms

LinkOut - more resources