. 2025 Jan 22;16(1):932.
doi: 10.1038/s41467-025-55914-x.

Real-world clinical multi-omics analyses reveal bifurcation of ER-independent and ER-dependent drug resistance to CDK4/6 inhibitors

Affiliations

Real-world clinical multi-omics analyses reveal bifurcation of ER-independent and ER-dependent drug resistance to CDK4/6 inhibitors

Zhengyan Kan et al. Nat Commun. .

Abstract

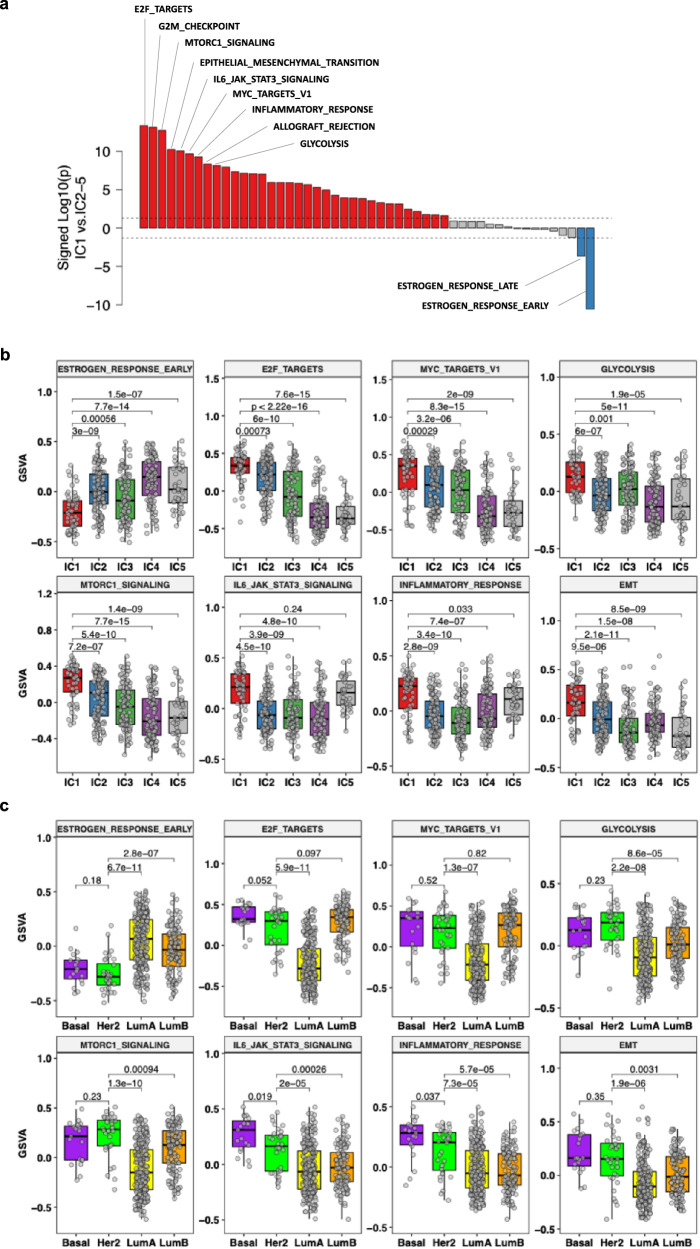
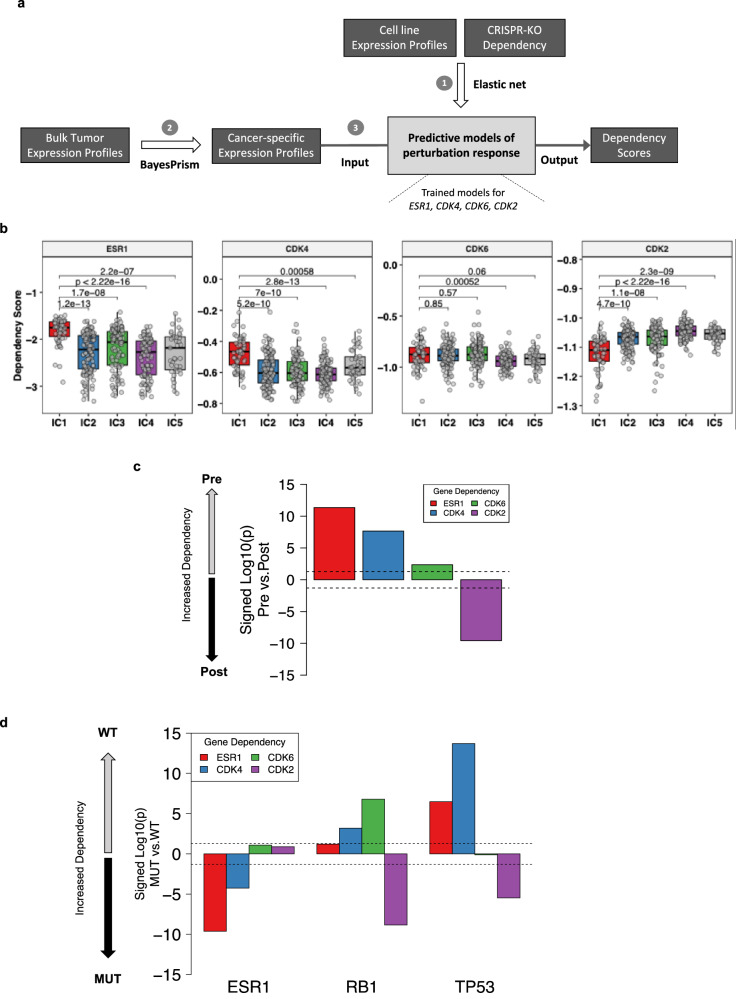
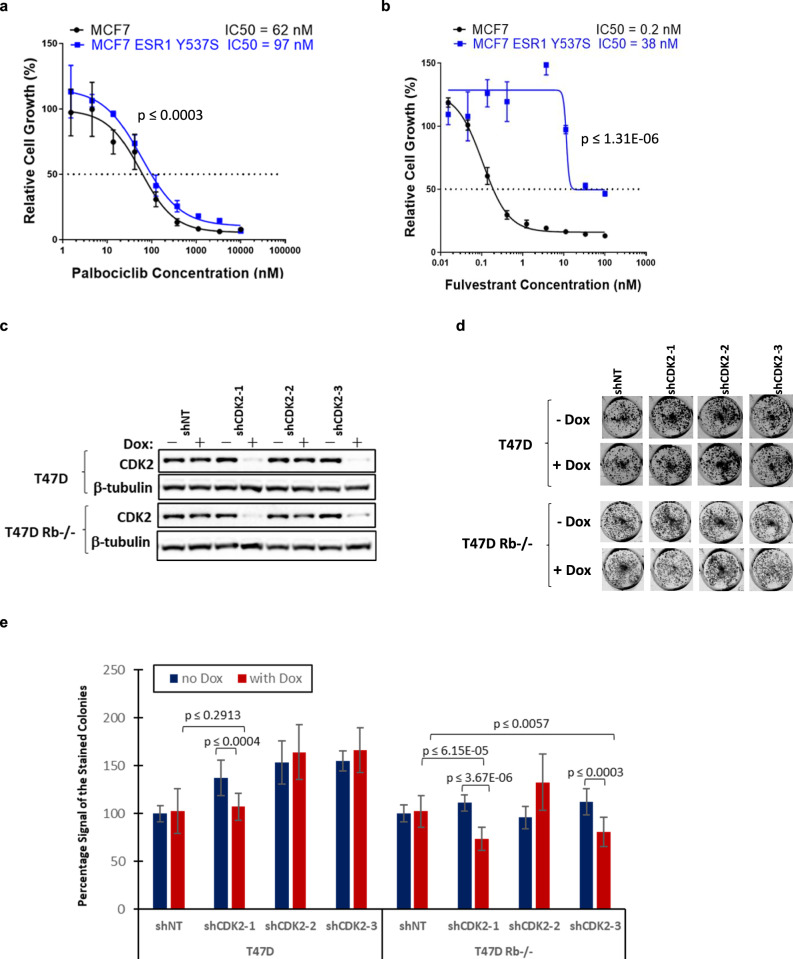
To better understand drug resistance mechanisms to CDK4/6 inhibitors and inform precision medicine, we analyze real-world multi-omics data from 400 HR+/HER2- metastatic breast cancer patients treated with CDK4/6 inhibitors plus endocrine therapies, including 200 pre-treatment and 227 post-progression samples. The prevalences of ESR1 and RB1 alterations significantly increase in post-progression samples. Integrative clustering analysis identifies three subgroups harboring different resistance mechanisms: ER driven, ER co-driven and ER independent. The ER independent subgroup, growing from 5% pre-treatment to 21% post-progression, is characterized by down-regulated estrogen signaling and enrichment of resistance markers including TP53 mutations, CCNE1 over-expression and Her2/Basal subtypes. Trajectory inference analyses identify a pseudotime variable strongly correlated with ER independence and disease progression; and revealed bifurcated evolutionary trajectories for ER-independent vs. ER-dependent drug resistance mechanisms. Machine learning models predict therapeutic dependency on ESR1 and CDK4 among ER-dependent tumors and CDK2 dependency among ER-independent tumors, confirmed by experimental validation.


Conflict of interest statement

Competing interests: The authors declare no competing non-financial Interests but the following competing financial interests. All authors were employees of Pfizer Inc. at the time the work was performed.

Figures

Fig. 1
Fig. 1. Molecular features associated with disease progression.
Schematic overviews of study design (a) and data analysis strategy (b). Volcano plots highlighting molecular features (c) and Hallmark gene signatures (d) significantly up regulated from Pre to Post and associated with shorter PFS at baseline. The y-axis shows the signed log10(p) representing the statistical significance of the change in feature value between Pre and Post, estimated by two-sided linear mixed-effects regression (LMER). % Change: percentage change in feature value in Post vs. Pre. Coef: effect size measured by regression coefficient from LMER analysis. The vertical dashed lines indicate the cutoffs >10% or <−10%. The horizontal dashed line indicates the cutoff for p value < 0.05. Each signature is colored based on its statistical significance, with red indicating that both cutoffs are met and blue and green indicating that only one of the cutoffs is met. −Log10 P: statistical significance. NS: not significant. e Systematic Pre vs. Post Comparison of Genomic Alteration Frequencies identified 7 genes with one-tailed fisher exact test p < 0.05 and alteration frequency in Post >5% and covered in all sequencing panels. Source data are provided as a Source Data file.
Fig. 2
Fig. 2. Integrative clustering analysis identified molecularly distinct subgroups.
a Heatmap showing distinct patterns of molecular features of five integrative clusters IC1-5. Panels of selected multi-omics features include gene expressions, hallmark signatures (GSVA), PAM50 subtype scores, ESTIMATE scores for tumor microenvironment, projection to Paloma3 NMF factors, gene-level genomic alteration status and other tumor characteristics. icluster: integrative cluster. Cyt score: cytolytic activity score. TMB: tumor mutation burden. Treatment status: Pre/Post. b KM plot comparing the PFS of patients classified into the five IC clusters. c Changes in the prevalence of IC clusters Pre vs. Post. d Distributions of ESR1, PGR and CCNE1 gene expressions vs. IC clusters, with sample sizes n = 57 (IC1), 127 (IC2), 97 (IC3), 107 (IC4), and 39 (IC5). Statistical significance was determined using two-sided Wilcoxon rank sum test. Distributions of TP53, ESR1, RB1, GATA3 mutation statuses (e) and MYC, CCND1 and FGFR1 amplification statuses (f) vs. IC clusters. g Diagram illustrating the hypothesis of stratifying HR+/HER2- mBC patients into three segments differentiated by the dependency on ER signaling as the oncogenic mechanism. The dotted line indicates that the ER co-driven tumor segment shares some characteristics with the ER independent segment, such as harboring higher RB1 mutation frequency than ER-driven tumors. For all box-and-whisker plots, the box is bounded by the first and third quartile with a horizontal line at the median and whiskers extend to the maximum and minimum value. Source data are provided as a Source Data file.
Fig. 3
Fig. 3. Differential expression patterns of tumor intrinsic gene signatures associated with ER independence.
a Waterfall plot showing the differential expression of 50 Hallmark signatures in IC1 vs. IC2-5. The y-axis shows the statistical significance as signed log10(p) values representing the statistical significance of the difference in mean signature scores between two groups. The dotted lines represent the significance cutoff (p = 0.05). Each signature is colored based on its statistical significance, with red indicating up-regulation in IC1 and blue indicating up-regulation in IC2-5. P-value is determined by Wilcoxon rank sum test. Distribution of IC1 up-regulated signatures vs. IC1-5 clusters (b) and PAM50 subtypes (c). Sample sizes for IC1-5 clusters are 57 (IC1), 127 (IC2), 97 (IC3), 107 (IC4), and 39 (IC5). Sample sizes for PAM50 subtypes are 19 (Basal), 32 (Her), 248 (LumA), and 121 (LumB). Statistical significance was determined using two-sided Wilcoxon rank sum test. For all box-and-whisker plots, the box is bounded by the first and third quartile with a horizontal line at the median and whiskers extend to the maximum and minimum value. Source data are provided as a Source Data file.
Fig. 4
Fig. 4. Trajectory inference analysis revealed a bifurcation of drug resistance mechanisms.
a Heatmap showing the tumor intrinsic expression patterns of 23 Hallmark gene signatures correlated with PT (Pearson correlation |r | >0.35). Shown in the top two panels are ESR1, PGR and CCNE1 gene expression (Gene) and four Paloma3 NMF factors (Paloma3). Samples are sorted by PT value shown in the top bar plot, and Proliferative Index is shown in the bar plot below. b Elastic Principal Graph (EPG) analysis identified a topology comprised of 3 branches and 21 nodes. Dotted lines represent inferred trajectory 1 (A-B) and trajectory 2 (A-C). c Distributions of EPG branches vs. integrative clusters. d Distributions of ESR1, PGR, and CCNE1 expression vs. EPG branches, with sample sizes n = 118 (A), 88 (B), and 84 (C). Statistical significance was determined using two-sided Wilcoxon rank sum test. Distributions of TP53, ESR1, RB1, GATA3 mutation statuses (e) and MYC, CCND1 and FGFR1 amplification statuses (f) vs. branches. For all box-and-whisker plots, the box is bounded by the first and third quartile with a horizontal line at the median and whiskers extend to the maximum and minimum value. Source data are provided as a Source Data file.
Fig. 5
Fig. 5. Drug target gene dependencies changed in ER-independent vs. ER-driven tumors.
a Workflow for applying elastic net models trained on CRISPR loss-of-function knockout (KO) screen data in cell lines to predict gene-level dependency using tumor gene expression profiles. b Distributions of predicted dependency scores for the four drug target genes ESR1, CDK4, CDK6, and CDK2 vs. integrative clusters, with sample sizes n = 57 (IC1), 127 (IC2), 97 (IC3), 107 (IC4), and 39 (IC5). A lower score indicates stronger dependency and greater sensitivity to gene knockout. Statistical significance was determined using two-sided Wilcoxon rank sum test. c Relative change in dependency scores for the four drug target genes in Post vs. Pre tumors. d Relative change in dependency scores for the four drug target genes vs. the mutation statuses of ESR1, RB1, and TP53. The y-axis shows the signed log10(p) values representing the statistical significance of the change in gene-level dependency scores between two subgroups, determined by two-sided Wilcoxon rank sum test. The dotted lines represent the significance cutoff (p < 0.05). MUT: mutated. WT: wild type. For all box-and-whisker plots, the box is bounded by the first and third quartile with a horizontal line at the median and whiskers extend to the maximum and minimum value. Source data are provided as a Source Data file.
Fig. 6
Fig. 6. Experimental validation of therapeutic hypotheses.
Dose response curves evaluating the viability of MCF7 and MCF7 ESR1 Y537S cells after exposure to Palbociclib (a) or Fulvestrant (b) at different concentrations for 7 days. Cells treated with DMSO were used as control for normalization. Data shown on the y-axis are mean ± SD (n = 3). P-values were calculated by one-tailed student’s t-test. c Western blot analysis was performed to determine the expression of CDK2 in the presence of 100 ng/ml Doxycycline. Cells were harvested at 4 days after the Doxycycline treatment and lysates were immunoblotted with the indicated antibodies. d Cell Colony formation assay was conducted in the 12-well plates in the absence or presence of 50 ng/ml Doxycycline. Crystal violet staining of cells was performed after 14 days of cell growth. Three shRNAs against CDK2 and one non-targeted shRNA as control were tested. e Quantitative analysis of cells colony formation by scanning the intensities of crystal violet stained cell colonies using LI-COR Odyssey CLx Imaging System. Data shown on the y-axis are mean ± SD (n = 12) of six replicates in two independent experiments. P-values were calculated by one-tailed Student’s t-test. Source data are provided as a Source Data file.

Similar articles

Cited by

References

    1. Howlader, N., et al. US incidence of breast cancer subtypes defined by joint hormone receptor and HER2 status. J. Natl. Cancer Inst.106, dju055 (2014). - PMC - PubMed
    1. Reinert, T. & Barrios, C. H. Optimal management of hormone receptor positive metastatic breast cancer in 2016. Ther. Adv. Med Oncol.7, 304–320 (2015). - PMC - PubMed
    1. Eggersmann, T. K., Degenhardt, T., Gluz, O., Wuerstlein, R. & Harbeck, N. CDK4/6 inhibitors expand the therapeutic options in breast cancer: palbociclib, ribociclib and abemaciclib. BioDrugs33, 125–135 (2019). - PubMed
    1. Pandey, K. et al. Molecular mechanisms of resistance to CDK4/6 inhibitors in breast cancer: a review. Int J. Cancer145, 1179–1188 (2019). - PMC - PubMed
    1. Formisano, L. et al. Aberrant FGFR signaling mediates resistance to CDK4/6 inhibitors in ER+ breast cancer. Nat. Commun.10, 1373 (2019). - PMC - PubMed

MeSH terms

Substances