. 2025 Jan 22;16(1):937.
doi: 10.1038/s41467-025-56023-5.

Fast updating feedback from piriform cortex to the olfactory bulb relays multimodal identity and reward contingency signals during rule-reversal

Affiliations

Fast updating feedback from piriform cortex to the olfactory bulb relays multimodal identity and reward contingency signals during rule-reversal

Diego E Hernandez et al. Nat Commun. .

Abstract

While animals readily adjust their behavior to adapt to relevant changes in the environment, the neural pathways enabling these changes remain largely unknown. Here, using multiphoton imaging, we investigate whether feedback from the piriform cortex to the olfactory bulb supports such behavioral flexibility. To this end, we engage head-fixed male mice in a multimodal rule-reversal task guided by olfactory and auditory cues. Both odor and, surprisingly, the sound cues trigger responses in the cortical bulbar feedback axons which precede the behavioral report. Responses to the same sensory cue are strongly modulated upon changes in stimulus-reward contingency (rule-reversals). The re-shaping of individual bouton responses occurs within seconds of the rule-reversal events and is correlated with changes in behavior. Optogenetic perturbation of cortical feedback within the bulb disrupts the behavioral performance. Our results indicate that the piriform-to-olfactory bulb feedback axons carry stimulus identity and reward contingency signals which are rapidly re-formatted according to changes in the behavioral context.


Conflict of interest statement

Competing interests: The authors declare no competing interests.

Figures

Fig. 1
Fig. 1. A Go/No-Go rule-reversal task using olfactory and auditory cues.
a Schematics of a behavior session and example FOV. (Left) An olfactory (1% ethyl valerate) or auditory (6.2 KHz tone) cue was delivered randomly in each trial, and each session was divided into stimulus-reward contingency blocks of ~45 trials. Stimulus-reward contingency was alternated between ‘Sound Go blocks’ (containing Sound Go and Odor-No-Go trials; pink) and ‘Odor Go blocks’ (containing Odor Go and Sound-No-Go trials; purple). (Right) Mice virally expressing GCaMP5 in the anterior piriform cortex (aPCx) with a chronic cranial window implanted above the olfactory bulb (“Methods” section, scale bar: 500 μm). (Inset) Example FOV of cortical bulbar feedback boutons (~300 μm from the bulb surface, scale bar: 30 μm). b In the ‘delay’ task, a variable inter-trial interval (ITI; flat hazard rate, “Methods” section) was followed by the delivery of a brief odor or sound cue (0.35 s) and a fixed 0.5 s interval (delay period) before the time when the reward became available. Mice were trained to report their decision (lick vs. no-lick) within a 1.5 s window from the end of the delay period. c In-session behavioral performance comparisons between early (Top) and expert (Bottom) sessions. Performance was quantified using a moving average window (bin size = 10 trials, “Methods” section). d Behavioral performance across sessions in the delay version of the task. (Top) Average behavior session performance. Zero marks the first session when mice experienced rule-reversal in the stimulus-reward contingency within a session. The red segmented line marks the behavioral threshold for expert performance (80%, “Methods” section); (Bottom) Average number of trials to reach 70% performance after each rule-reversal event (“Methods” section). (N = 9 mice; Error bars: ±SEM). e (Top) Example licks (dots) from odor and sound trials (Top vs. Bottom rows) parsed by trial instruction (Go: Left; No-Go trials: Right) from one delay session. (Bottom) Distributions of report latency to the first lick from cue onset for all delay sessions (N = 3 mice) sound trials (yellow; 930.8 ± 3.7 ms) and odor trials (blue; 986.4 ± 7.6 ms). Inset: detail of the time period marked by black bar.
Fig. 2
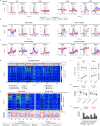
Fig. 2. Fast update of cortical bulbar feedback representations following reward-rule switching in task-engaged mice.
a Example average responses (z-scored) of cortical bulbar feedback axon boutons to odor and sound cues during Go (blue) and No-Go (red) trials. Shaded areas mark different trial periods: cue (gray); delay (green); report (pink). b, c Example boutons that displayed stable (Left) or unstable (Right) average responses to odor (b) and sound (c) across conditions (Go vs. No-Go; “Methods” section). d Bouton responses (z-scored) averaged throughout the delay period and shown across trials in an example field of view from an expert mouse. Each row shows the response of one bouton across trials and blocks throughout the behavior session. Boutons are sorted from top to bottom by the strength of their response during the odor trials of the Odor Go blocks. Color-coded bars on top mark the block structure, cue identity, and trial outcome. e (Top) Same session as (d), re-sorted by cue identity: odor trials (Left) and sound trials (Right). Boutons were classified as enhanced, unresponsive, suppressed, or complex (enhanced +  suppressed) as per their response strength and polarity to the odor cue; (Right) the same ordering of boutons was kept for the sound trials. (Bottom) Inter-block correlation analysis (Odor Go vs. Sound Go; “Methods” section). f Average z-scored response values during the delay period parsed by the cue (Odor or Sound) and instruction (Go or No-Go). Each pair of connected colored dots represents average z-scored responses across conditions (Go vs. No-Go) from individual sessions. Black dots represent the average ensemble bouton response across sessions (N = 20 sessions, 3 mice). Two-sided Student’s t-test: *** = p < 0.0001; n.s.: non-significant. g Average inter-block correlation coefficients obtained as described in e, bottom for all fields of view (delay; “Methods” section). Each pair of gray connected dots represents the inter-block correlation values computed for one session. Black dots represent the average correlation across sessions (N = 20 sessions, 3 mice). Two-sided Student’s t-test: *** = p < 0.0001. h Same analysis as in (g) including comparisons across modalities. All panels error bars: ±SEM. See Source Data and Supplementary Table 1 for exact data points and p-values.
Fig. 3
Fig. 3. Cortical bulbar feedback represents stimulus identity, contingency, and behavioral outcome.
a Histogram of individual bouton response correlation values across trials as a function of behavioral contingency (Hits, H vs. false alarms, FA vs. correct rejections, CR) in Odor (Left) and Sound (Right) trials. Bouton responses were sampled between cue onset and end of the delay period (before licking, “Methods” section). Inset: Bouton response stability across conditions (H/H, H/CR, H/FA, CR/FA) reported using as reference the 90th percentile of the Hit/Hit bouton response correlation distribution (bootstrap analysis, “Methods” section). b Individual bouton response stability analysis for trials where mice subsequently licked the reward spout (hits and false alarms). Note the differences in trial-to-trial response correlation distributions when comparing Odor H/H vs. Odor H/FA vs. Odor FA/Sound FA trials. a and b: N = 20 sessions, 3 mice. Two-sided One-way ANOVA and multiple comparisons of means: * = p < 0.05 compared to ‘odor H/H’ bouton stability. c Principal component analysis (PCA) for one example session: feedback bouton ensemble response trajectories plotted in a space defined by the first three principal components (74.5 and 73.7% variance explained respectively for odor and sound trials); population response trajectories rapidly diverge as a function of trial contingency for both Odor (Left) and Sound (Right) trials. Miss (M) trials were excluded from the analysis due to their low frequency (<3%). Different task periods in each trajectory are represented by distinct traces (baseline: thin continuous; cue: thick continuous; delay: thick interrupted; report: thick dotted line). d Multi-layer perceptron classifiers were trained to decode stimulus identity (odor or sound), behavioral contingency (H, FA, CR), trial instruction (Go or No-Go), and behavior (lick or no-lick) in the delay version of the task. Top: Average classifier performance across all sessions normalized relative to baseline performance. When shuffling trial labels on the training data, the average classifier performance was 0. Bottom: Distribution of the number of licks per second across all sessions. See Source Data and Supplementary Table 1 for exact data points and p-values.
Fig. 4
Fig. 4. Cortical bulbar feedback responses represent stimulus contingency in an auditory-only Go/No-Go task.
a Example average responses of individual cortical bulbar bouton responses to Go (Sound A, Left) and No-Go (Sound B, Right) cues in an auditory-only Go/No-Go task. Shaded areas mark different task periods: cue (gray); delay (green); report (pink). Blue (Sound A) and red (Sound B) traces represent the average change in fluorescence across trials (z-scored). b Average cortical feedback bouton responses in example fields of view parsed by instruction (Go or No-Go) and across days of training (naïve, day 4, and day 6). c Average multi-layer perceptron performance for decoding the instruction signals (Go vs. No-Go) across training sessions (N = 3 mice per day) for the task in (a, b). d Peak performance of classifier sampled from cue onset to the end of the delay period in the auditory-only Go/No-Go task. Error bars: ±SEM.
Fig. 5
Fig. 5. Cortical bulbar feedback activity mirrors the perceived reward rule.
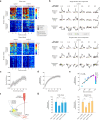
a Example bouton responses during block transitions sampled throughout the ‘delay period’ from one field of view in an expert mouse. (Top) Odor trials. (Bottom) Sound trials. Gray bars mark the trial outcome (correct – light gray; incorrect – dark gray). b Example individual bouton response traces from (a) (asterisks) to odor (Top) and sound (Bottom) before and after the contingency switch (0; vertical line). Interpolated responses are shown (“Methods” section). c Block transition neuronal distance analysis: Pearson correlation (ρ) was calculated between the bouton ensemble response (delay period) of a given trial of the current block and the average bouton ensemble response over the last five trials of the preceding block. The average neuronal distance is defined as 1 – ρ, and shown for the first twelve trials of a given block (N = 20 sessions, 3 mice). d Average behavioral performance following block transitions across sessions (N = 20 sessions, 3 mice; “Methods” section). e Correlation between the neuronal distance and the block behavioral performance. Color bar: Trial index of each correlation value (N = 20 sessions, 3 mice). Pearson’s Correlation: R2 = 0.85 (p < 0.0001). f Optogenetic perturbation of aPCx-originating feedback locally within the olfactory bulb (“Methods” section). In expert mice, cortical feedback was suppressed 500 ms before the start of the cue period and continued until the end of the reporting period (2.4 mW, 595 nm) in 25% of the trials of a behavior session. g Behavioral performance quantified for odor (Left) and sound (Right) trials independently in Jaws-aPCx and EGFP-aPCx expressing mice: (Jaws – no-light) vs. (Jaws – 2.4 mW) light-on trials. Two-sided One-way ANOVA and multiple comparisons of means: *** = p < 0.0001; n.s.: non-significant. All panels error bars: ±SEM. See Source Data and Supplementary Table 1 for exact data points and p-values.

Update of

References

    1. Zingg, B. et al. Neural networks of the mouse neocortex. Cell156, 1096–1111 (2014). - PMC - PubMed
    1. Harris, J. A. et al. Hierarchical organization of cortical and thalamic connectivity. Nature575, 195–202 (2019). - PMC - PubMed
    1. Huang, L. et al. BRICseq bridges brain-wide interregional connectivity to neural activity and gene expression in single animals. Cell182, 177–188.e27 (2020). - PMC - PubMed
    1. Wang, X.-J. & Kennedy, H. Brain structure and dynamics across scales: in search of rules. Curr. Opin. Neurobiol.37, 92–98 (2016). - PMC - PubMed
    1. Chklovskii, D. B. & Koulakov, A. A. Maps in the brain: what can we learn from them? Annu. Rev. Neurosci.27, 369–392 (2004). - PubMed

LinkOut - more resources